Concern about sequence of return risk is a common worry among those who have explored risk analysis.
Michael Kitces expresses the concern this way:
Watching a portfolio experience market volatility in the first few years of retirement can be terrifying to a new retiree, raising legitimate questions of whether there’s a danger that early declines plus ongoing withdrawals could lead to a retirement spending shortfall. And as the safe withdrawal rate research has shown, that danger is real – in fact, it’s been dubbed the “sequence of return” risk to retirement spending, a recognition of the reality that even if returns average out in the long run, it doesn’t matter if ongoing withdrawals deplete the portfolio before the “good” returns finally show up.
MaxiFi Planner Premium allows you to have a look at how vulnerable you are to an unfortunate negative sequence of returns, which could happen at any time, but is especially stressful (and potentially damaging) early in the withdraw period.
Let's take a case where a household is entering retirement in their early 60s and using MaxiFi Living Standard Risk Analysis to assess the impact of two investment strategies: a 50/50 stock/bond mix on the one hand and a 100% all S&P index on the other. First we can take a look at the representation of this data as charts. Then, below, we'll view the specific returns percentages for particular years as a table. These charts represent five out of 500 return sequences showing the real rate of return through the roughly 40-year period from age 60-100.
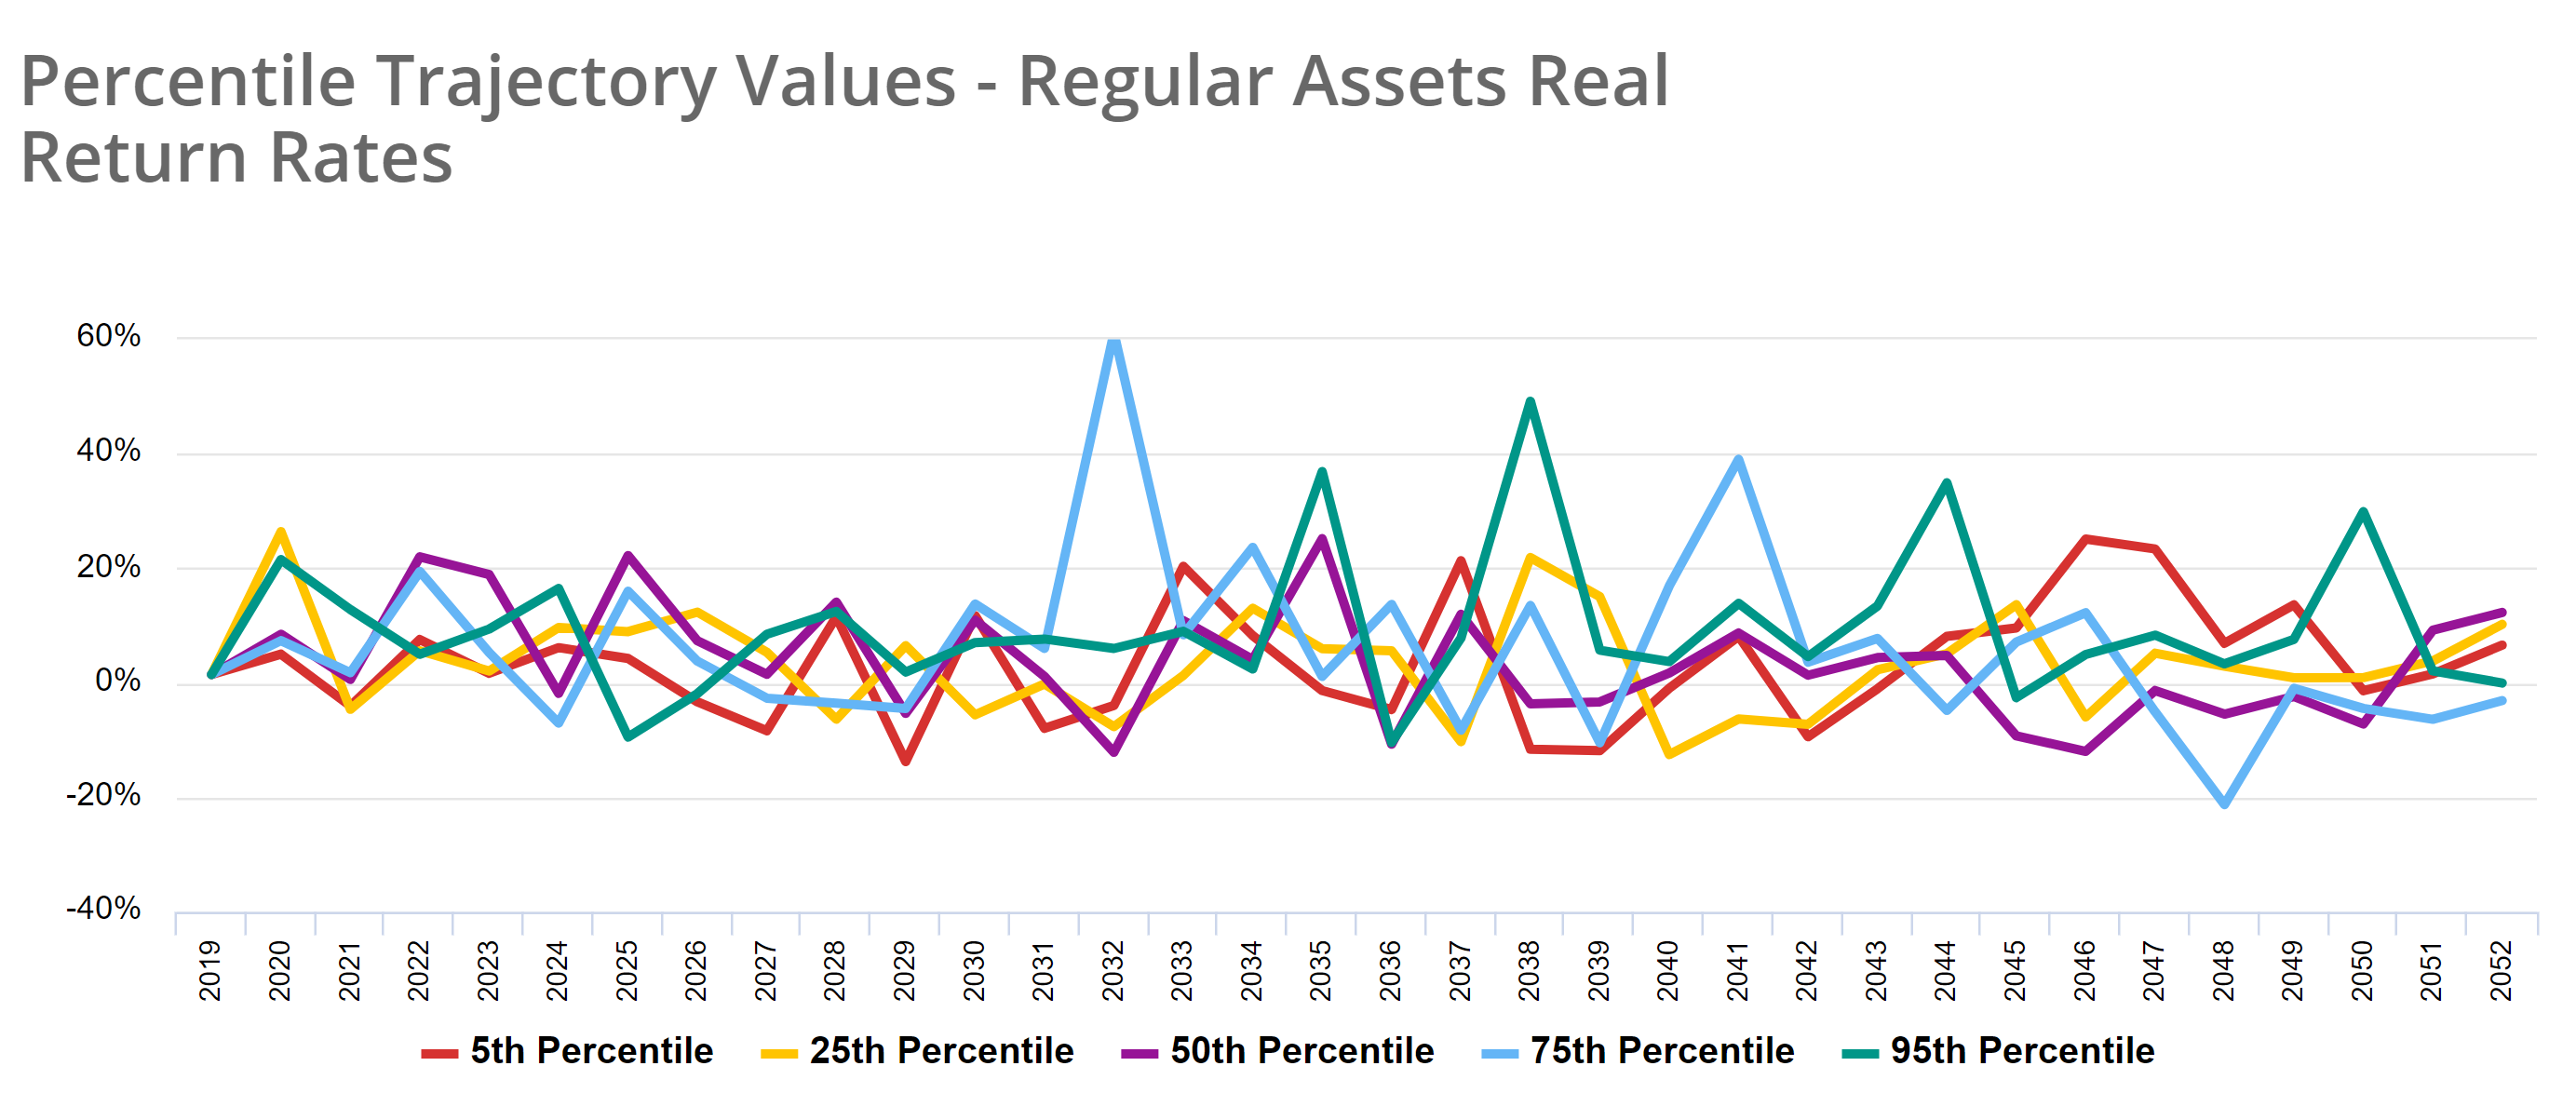
This first chart represents the 50/50 stock/bond allocation investment strategy.
This second chart represents the 100% stock allocation investment strategy.
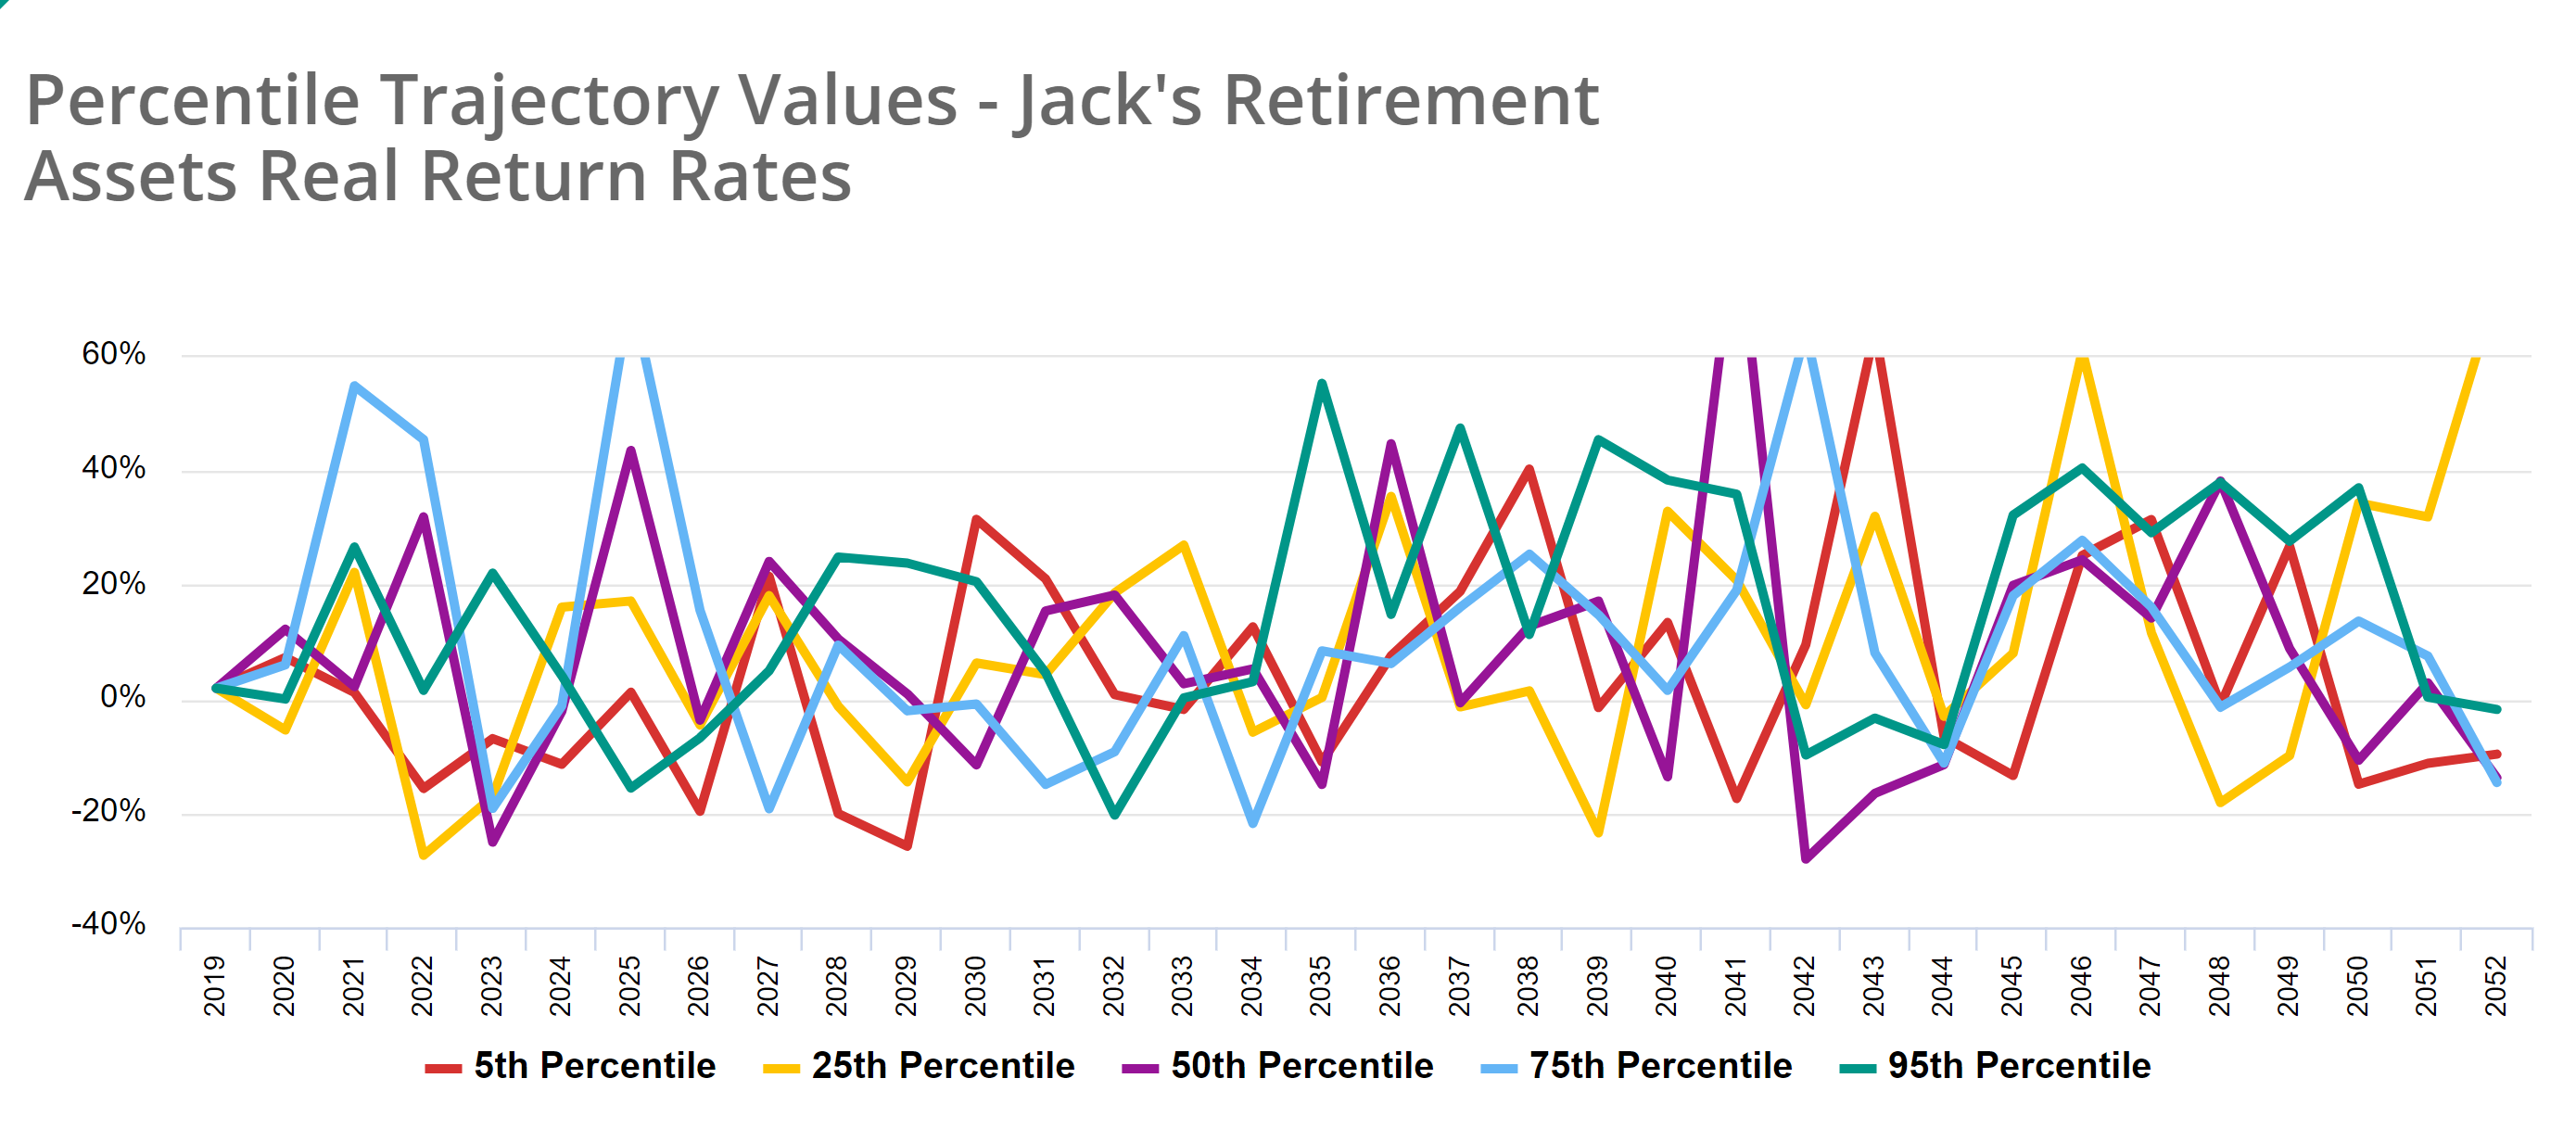
At first glance we can observe that the variation in the sequence for the 50/50 portfolio is not as volatile as the all-stock portfolio. The bonds in the first chart have the effect of muting the volatility in a way that keeps the rate of return clustered more closely to the mean. When we try to follow any one trajectory, however, it's difficult to see at a glance the specific sequence of annual returns. So next we'll view these same two charts as tables of data.
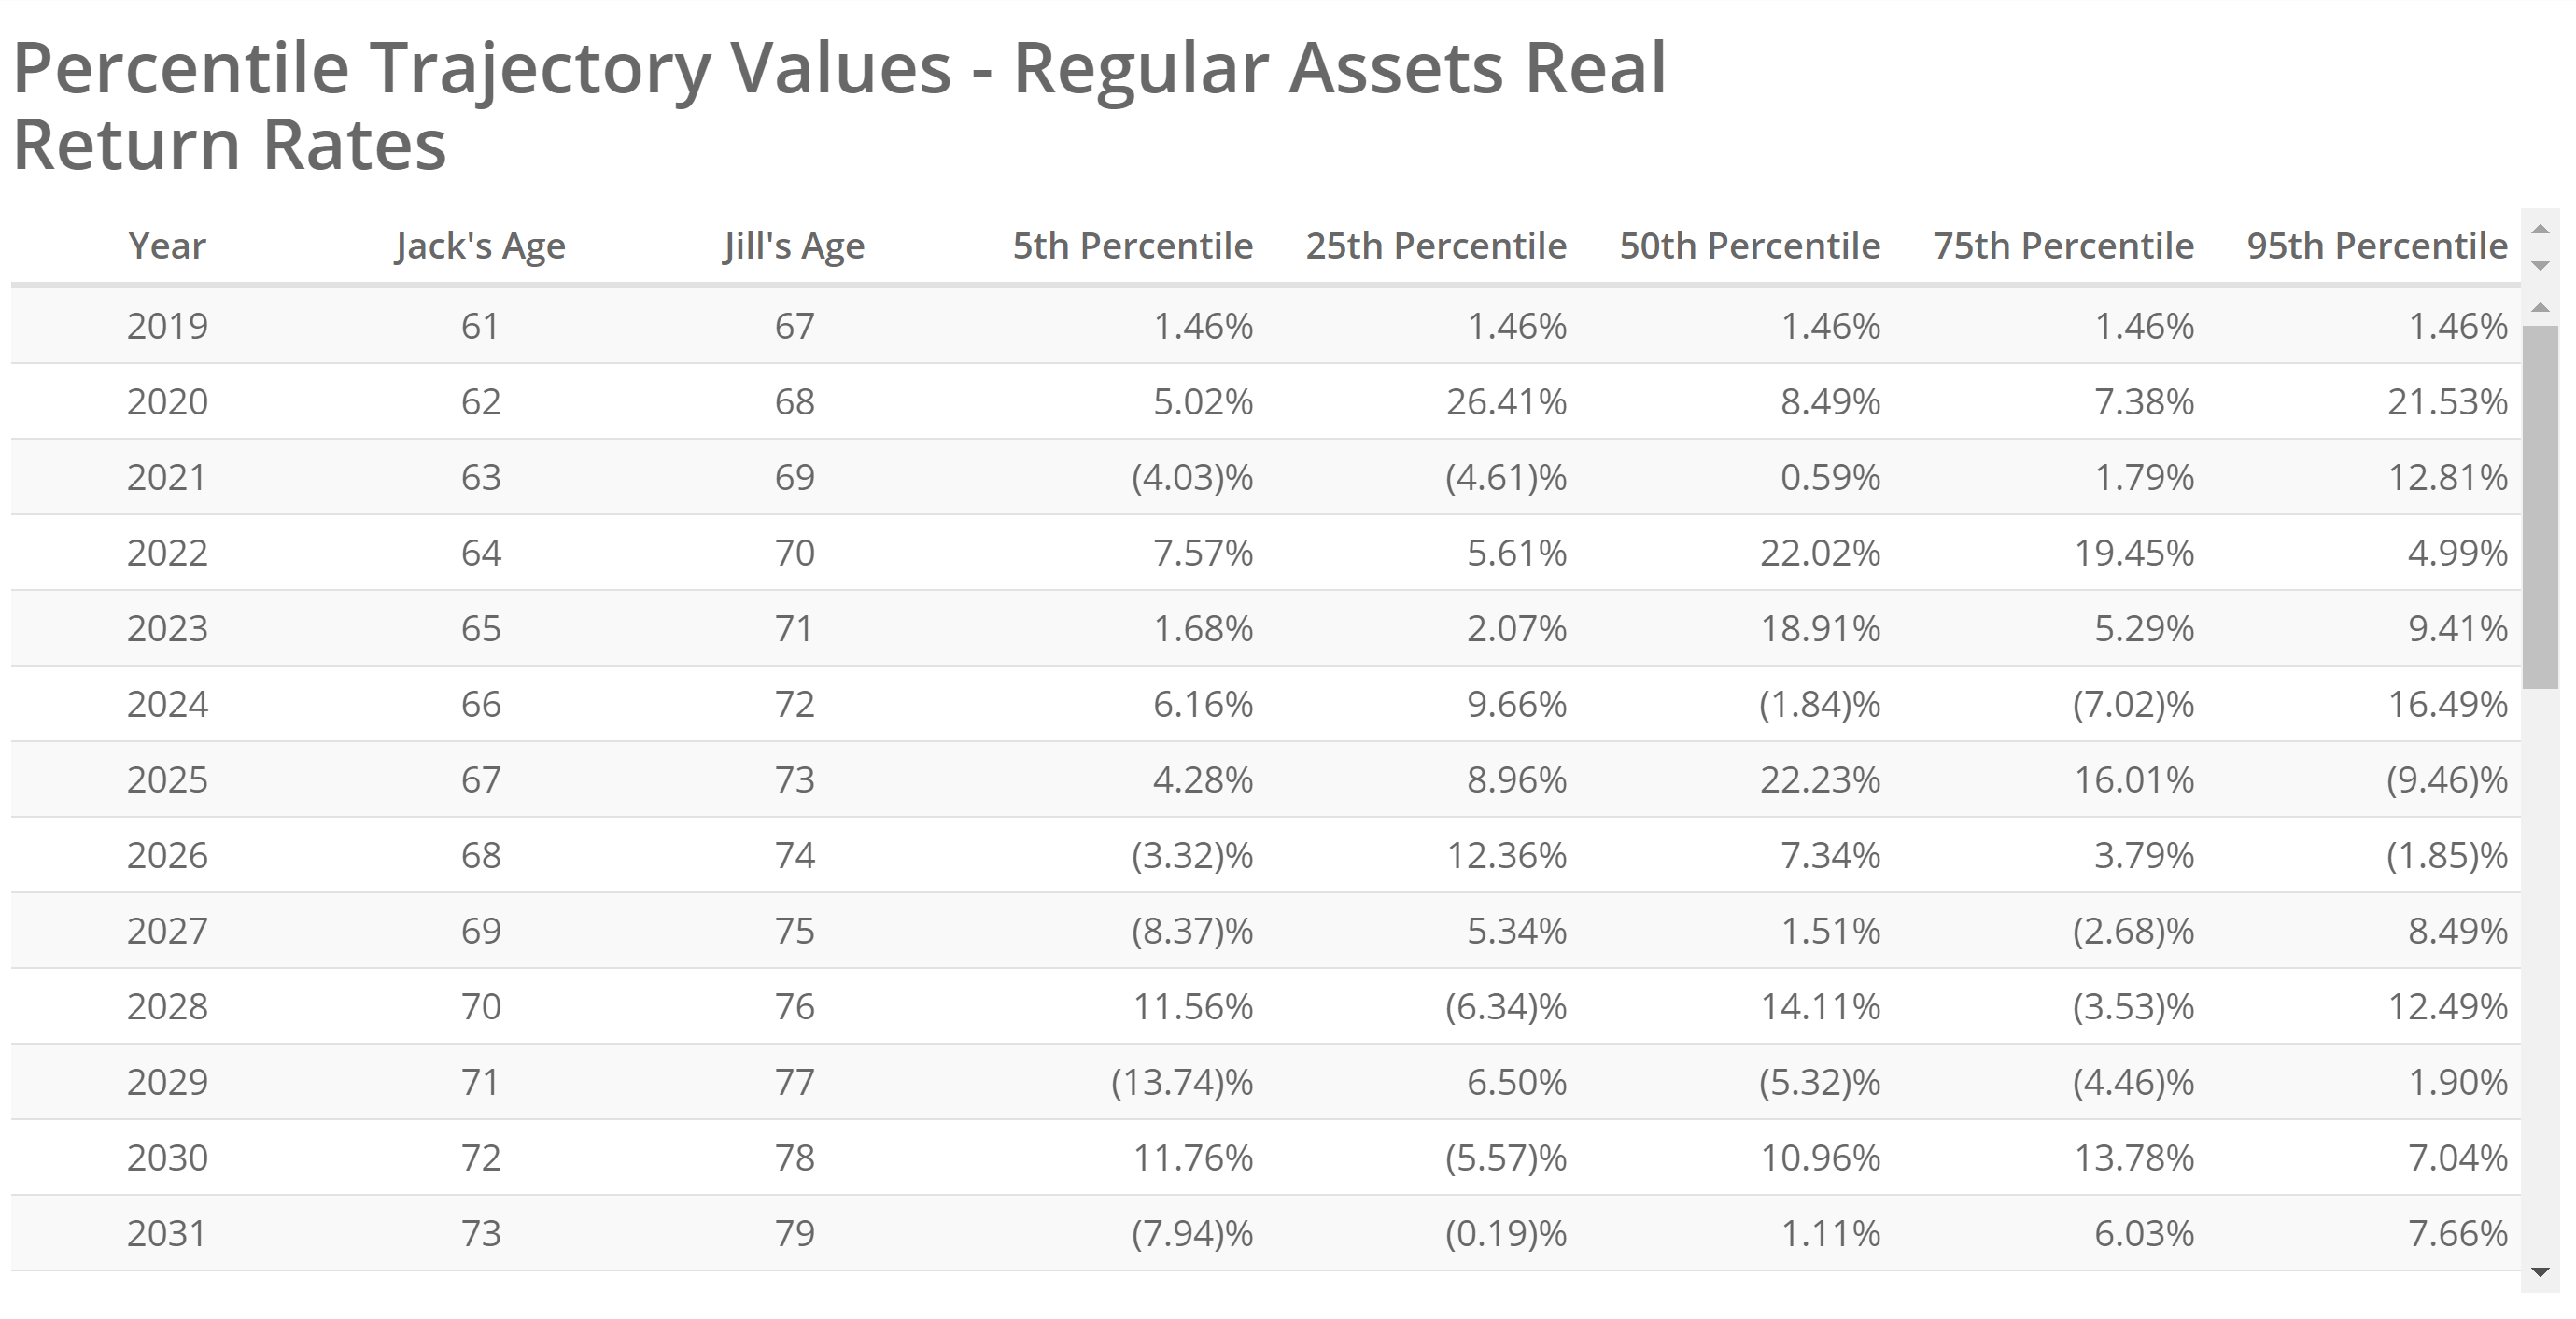
This first table represents the 50/50 stock/bond allocation investment strategy.
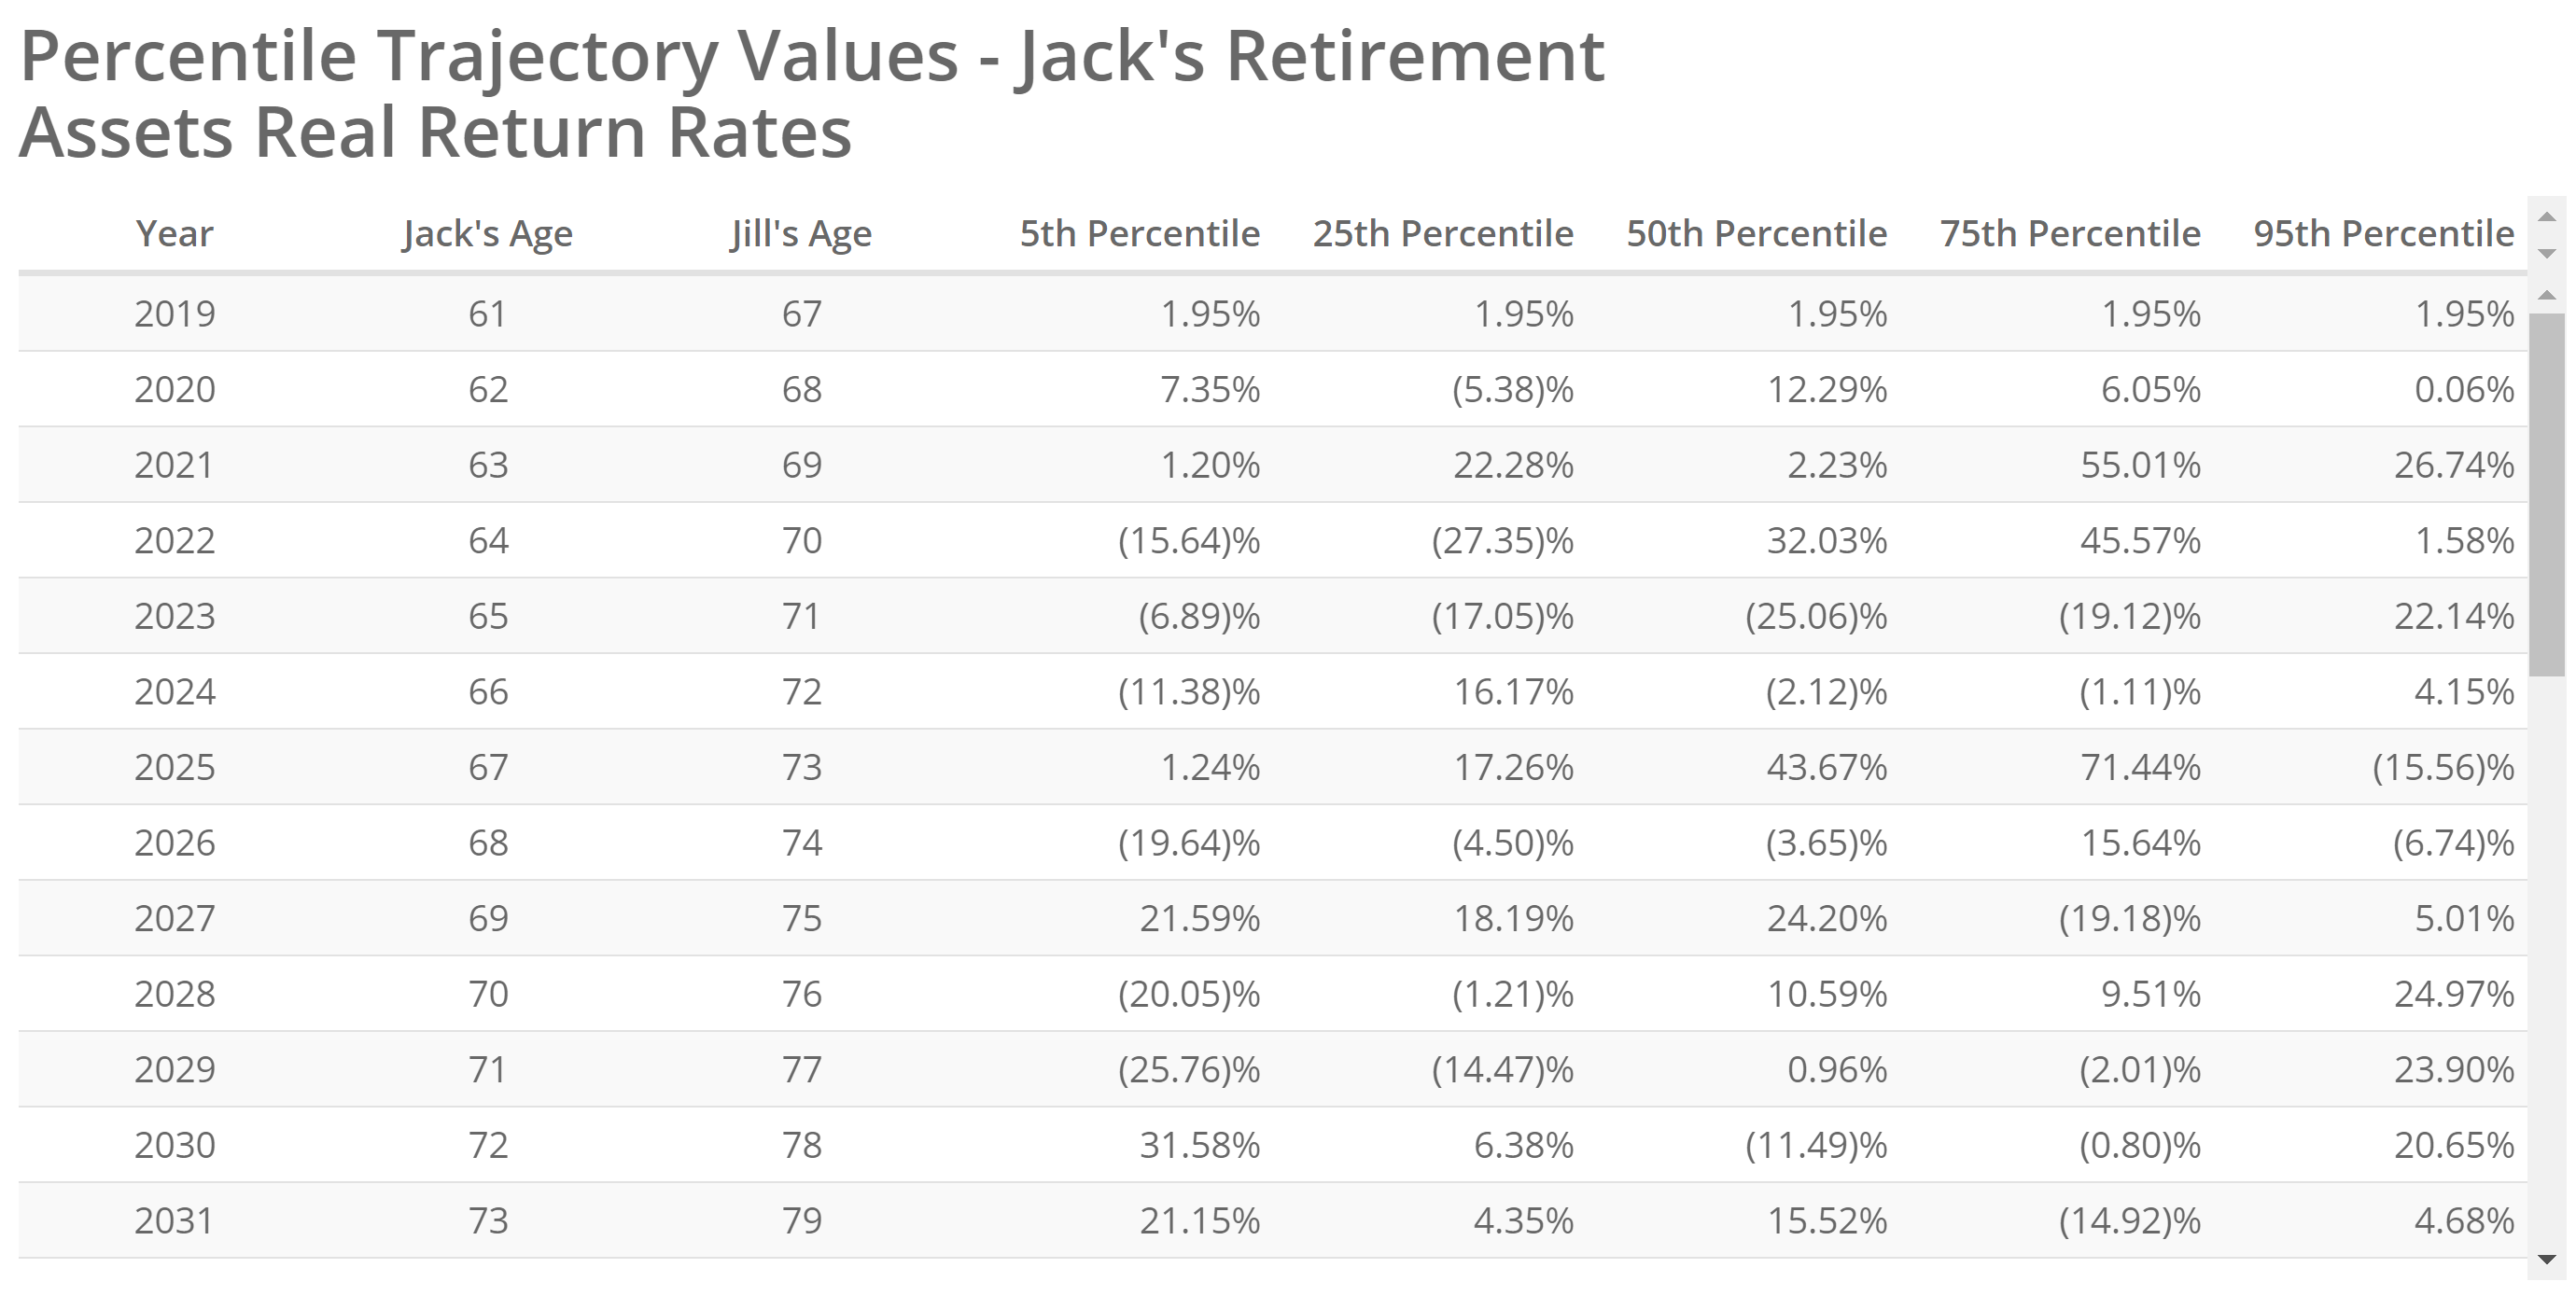
This second table represents the 100% stock allocation investment strategy.
The actual sequence of real returns for the first thirteen years are shown here in these tables. Each column shows a specific sequence or trajectory. The first table, the 50/50 strategy, shows the reason why people use bonds in their portfolio: the variation from year to year is reduced in comparison to the second table, the 100% stock strategy, which reveals much greater variance. This all-stock case was run 500 times, with each run pulling a random return possibility given the statistical history of the S&P 500 (back to 1926). Instead of showing all 500 return sequences (i.e., all 500 columns) we sort them all according to lifetime average from worst to best and show just five. For the 5th percentile column, we understand that 95% of the other 499 columns yielded higher average living standards and 5% were lower.
In contrast to the 50/50 portfolio where there is just one negative double-digit return in any trajectory in the first 13 years (-13.74%), the 100% stocks strategy shows us that in the 5th percentile sequence alone there are 5 double-digit negative returns in the first 13 years, including back-to-back returns lower than -20%.
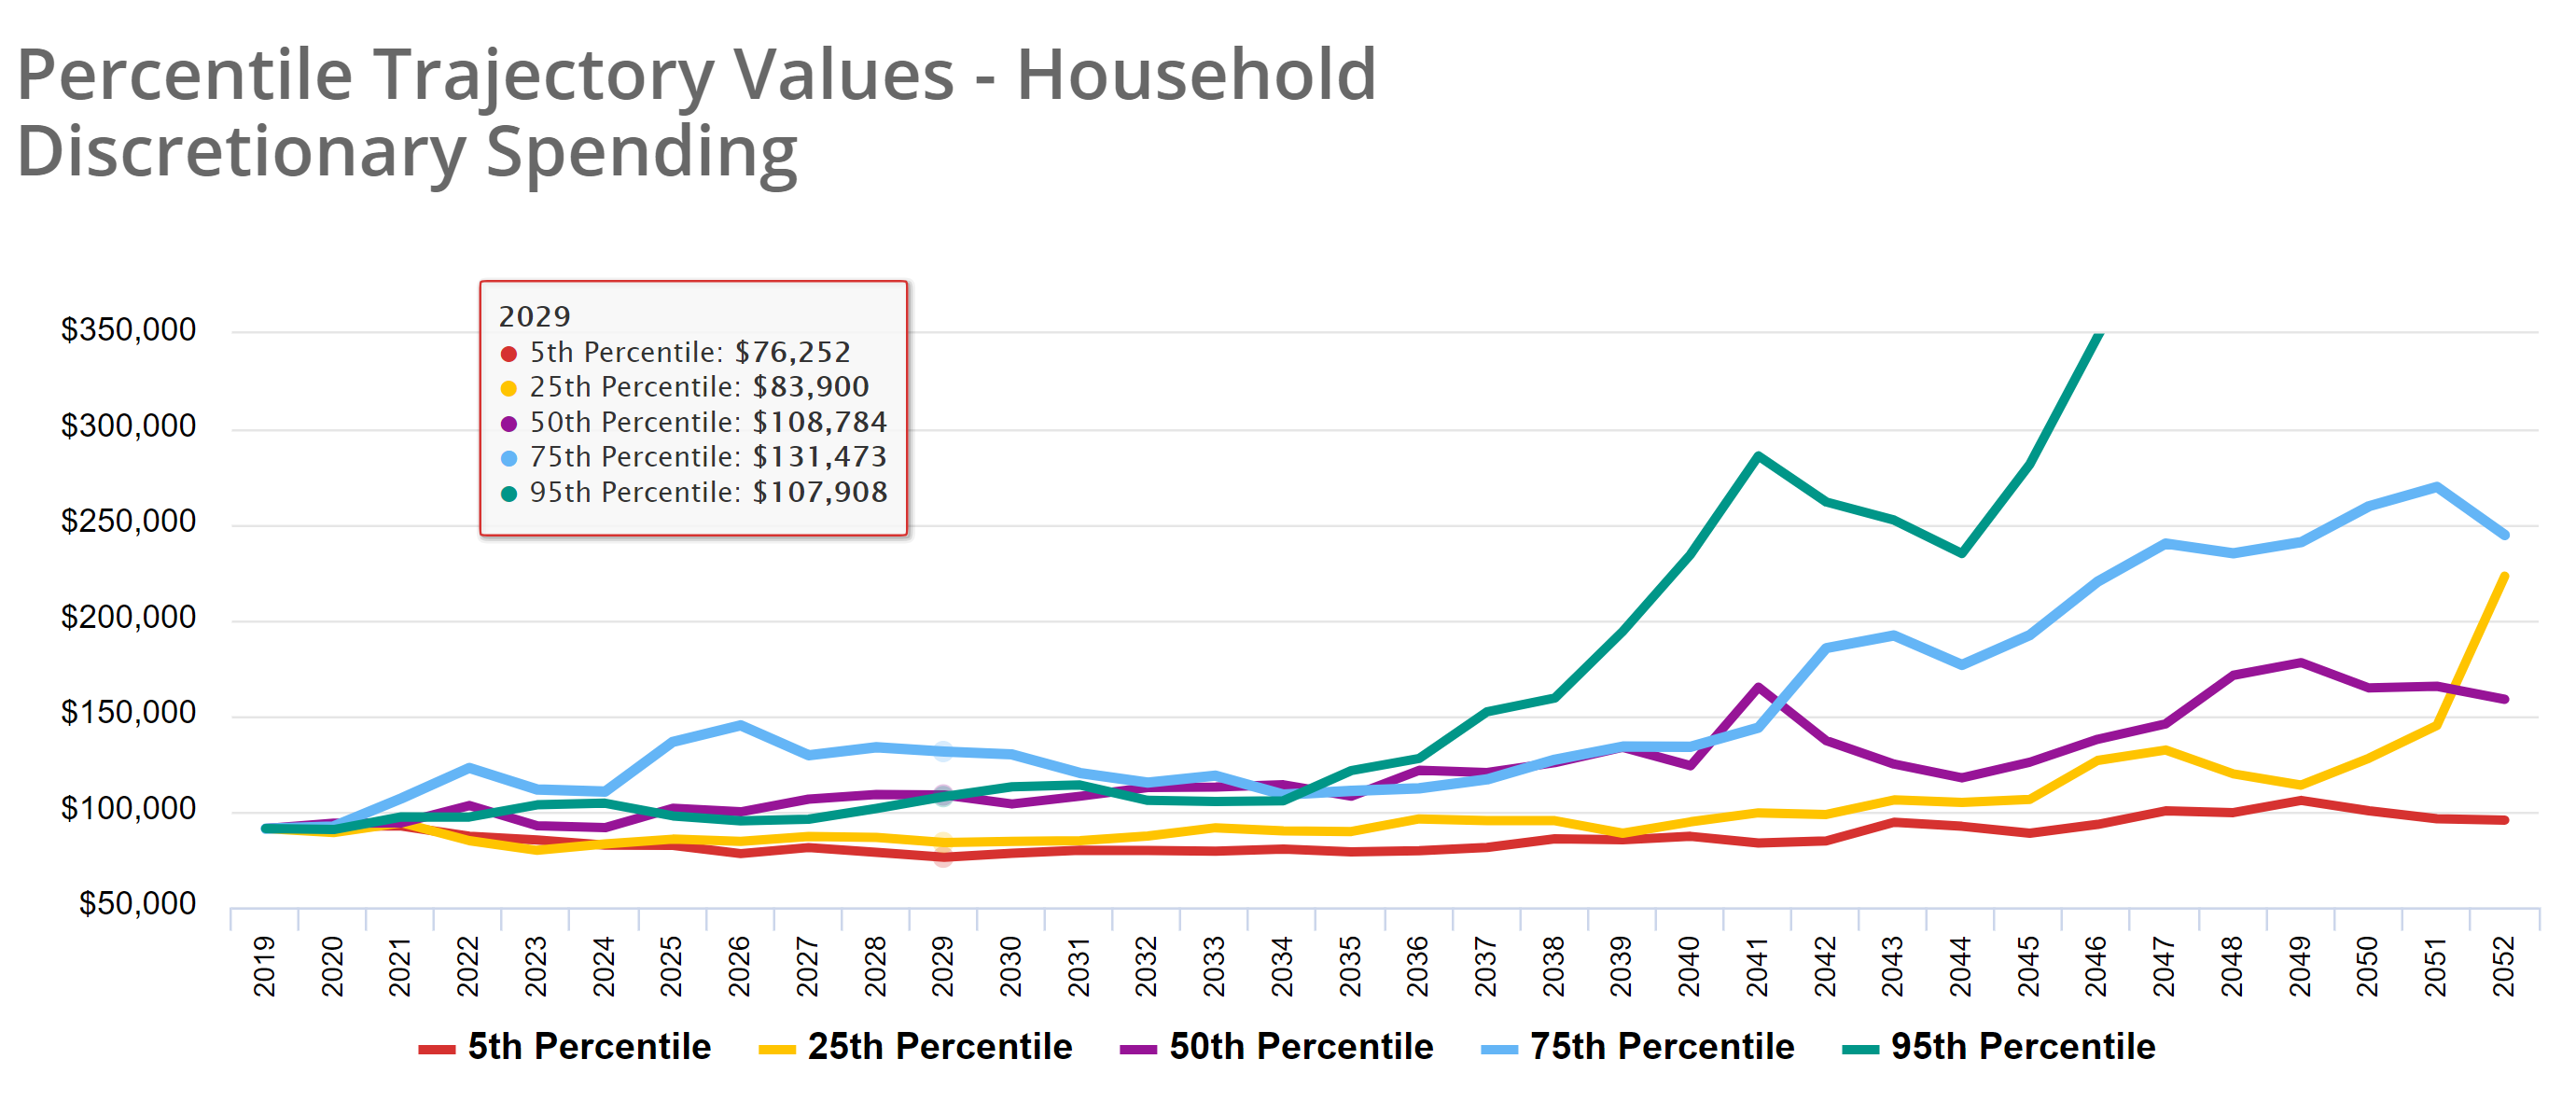
What do we about how to avoid a sequence of returns risk? First of all, it's important to notice that in MaxiFi's analysis it's not just account withdraw balance where we see the impact of sequence of return. We see the impact also, and most importantly, in how those balances impact the discretionary spending amounts. The discovery of sustainable annual spending is the whole point of long-term planning, and MaxiFi is designed specifically to reveal that annual spending level as a consequence of the mutual influence of all the variables. We can see in the chart below that the 5th percentile trajectory of discretionary spending (the red line) is disappointing compared to the others (the annual discretionary spending begins at $91,181 and hits a low of $76,252 in 2029). Nevertheless, at no time in any of the 500 trajectories does the model reflect a situation where expenses exceed available income (i.e., a failed model). The lowest available discretionary spending is seen in 2029.
This third chart represents the discretionary spending for the all-stock portfolio.
Michael Kitces concludes his analysis by pointing out that there is remarkably little relationship between a sustainable withdraw pattern and the returns in the first year or two of the withdraw sequence. "Instead," he points out,
. . . it turns out that the true driver of sequence of return risk and safe withdrawal rates are the returns that the retiree earns over the first decade – and specifically, the real returns over the first decade, that provide an indication of whether the retirement portfolio will have produced enough real growth to keep up with inflation-adjusted spending for the rest of retirement.
MaxiFi's Monte Carlo risk analysis provides a way for us to model such a bad sequence of returns as we've seen above where the 5th percentile return sequence demonstrated the impact on annual spending when there were five double-digit negative returns in the first decade of withdraws.