A couple have a major decision, which will influence their investment risk. They need to decide how aggressively to spend through time.
The Facts
Married couple, Age: 54
Sam’s earnings: $50,000
Martha’s earnings: $200,000
Combined 401k savings: $1,000,000
Regular Assets: $400,000
Housing: Own $1,000,000 home
Sam and Martha have decided to invest their regular and retirement account assets half in stock and half in bonds over the rest of their lives. But they still have a major decision, which will influence their investment risk. They need to decide how aggressively to spend through time.
At one extreme, they could consume all their assets and remaining labor earnings as quickly as possible. This will limit their future living standard risk for the simple reason that they’ll have little or no resources available to spend down the road regardless of how well stocks and bonds perform. This strategy entails a very safe, but very unpleasant future. I.e., there is little or no investment risk, but very low lifetime utility, the term economists use to reference lifetime happiness.
At the other extreme, Sam and Martha could play it super safe and consume next to nothing until they reach the end of their days. This will ensure they’ll have the most money possible in the future whatever returns they earn on their assets. But like overspending, underspending is no fun. It entails severe deprivation for Sam and Martha in the short run in order to more fully protect their long run.
To see how super aggressive, cautious, and super conservative spending compares in terms of the pattern of their potential living standard trajectories as well as their average (also called expected) lifetime utility, Sam and Martha run MaxiFi’s risk analysis assuming, for the Base strategy, a 50-50 stock-bond portfolio allocation and a 1 percent “as if” real return (a 3.5 percent nominal return for their regular and retirement account assets coupled with a 2.5 percent assumed future inflation rate). This “as if” real return means that, in any future year, Sam and Martha will spend assuming they’ll earn, for sure, 1 percent real in the future on their investments regardless of what returns the market has generated up to that point in time.
For the Safe strategy, Sam and Martha also assume 50-50 stock-bond holdings, but specify a negative 5 percent “as if” real return. Their Risky strategy also entails a 50-50 stock-bond portfolio split, but assumes a positive 5 percent “as if” real return. Spending through time as if you’ll earn a large negative real return is, clearly, taking a very cautious approach. Spending through time as if you’ll earn a high positive real return entails doing the opposite – spending as if you are sure you’ll do well on the stock and bond markets through time.
High and Low Standard of Living Trajectories Under Alternative Spending Strategies
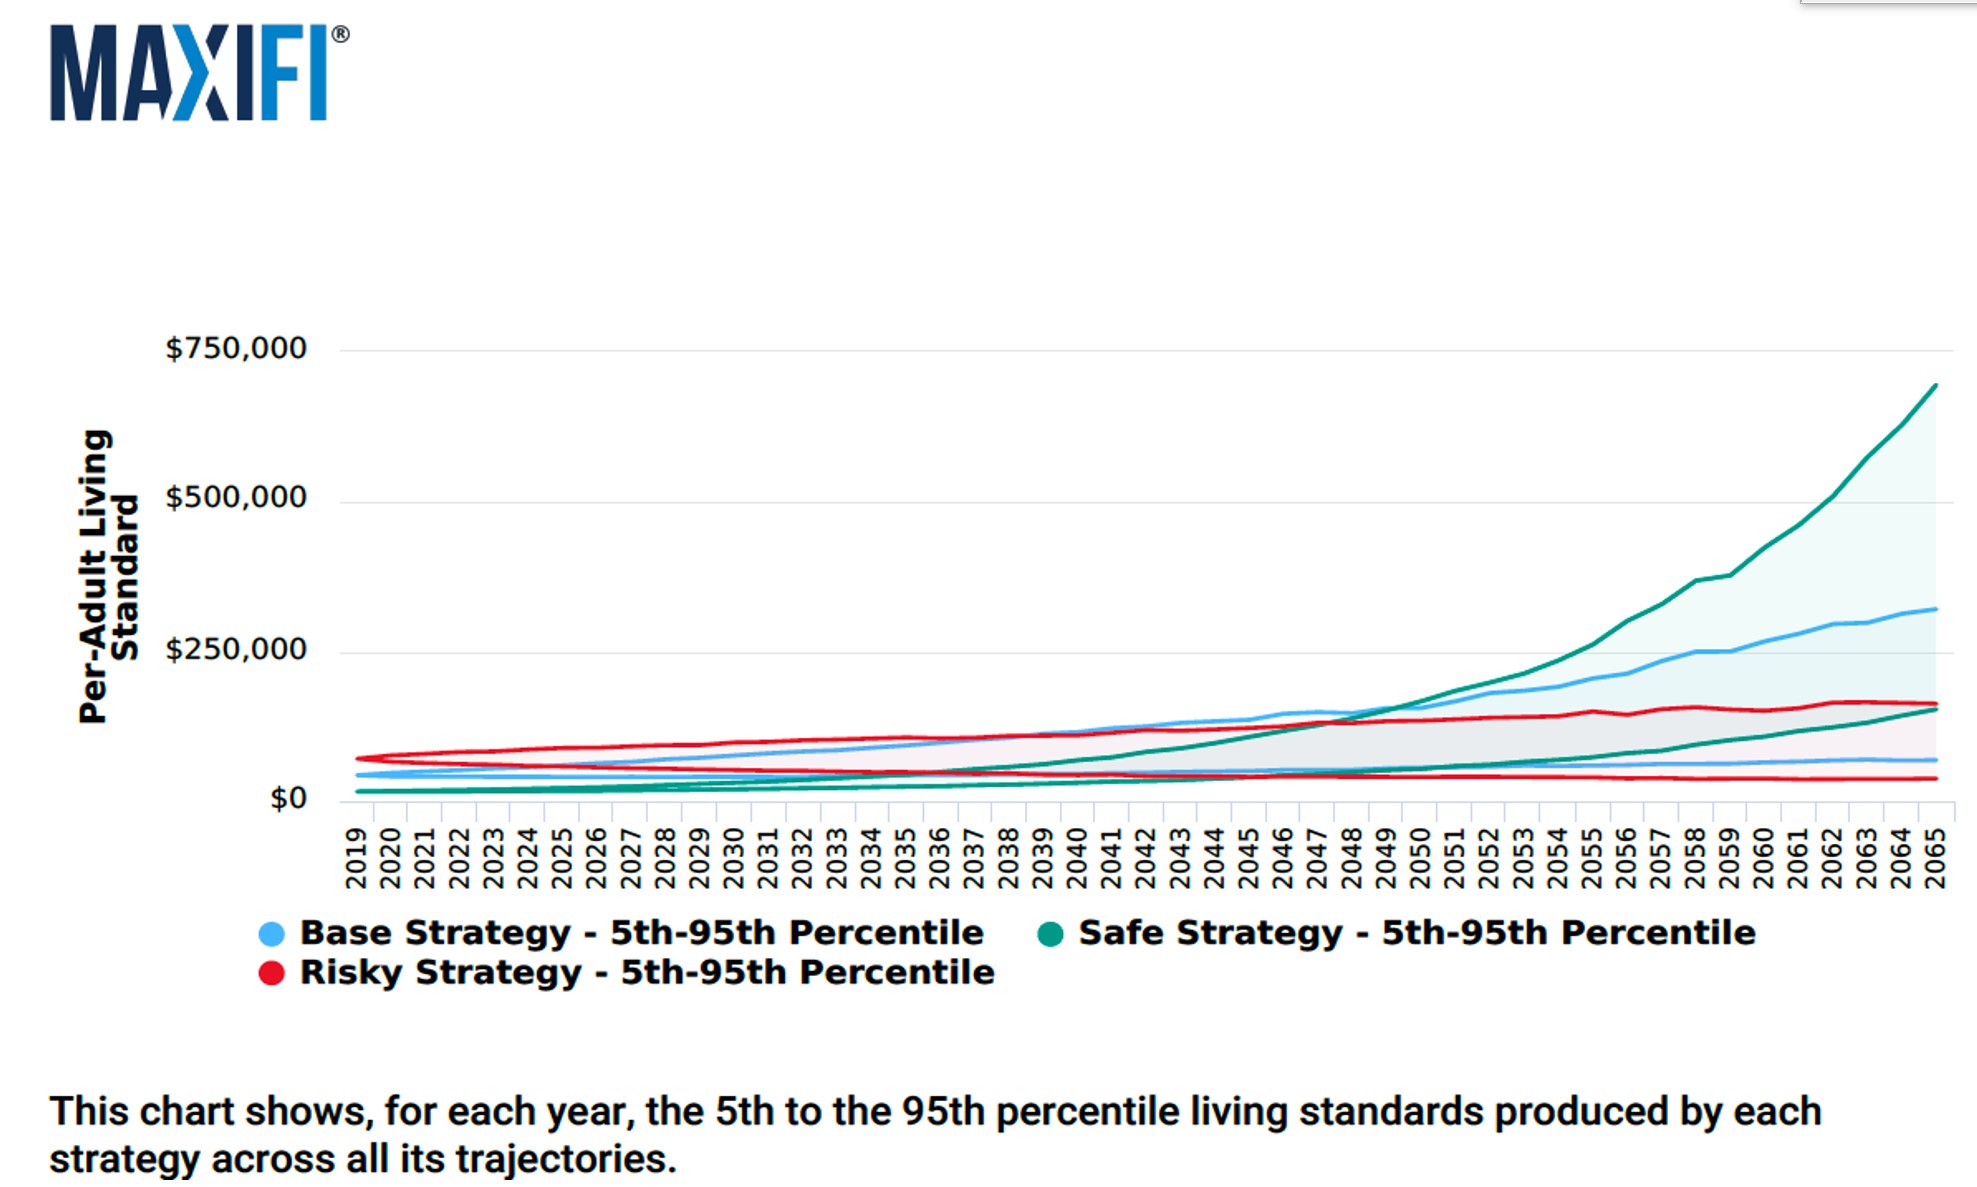
The blue, green, and red curves in the figure below show the 5th and 95th percentile living standard trajectory curves for the Base, Safe, and Risky strategies, respectively. Again, the curves differ due to different specified spending, not investing strategies. For each strategy, MaxiFi generates 500 living standard trajectories. These are Monte Carlo trajectories since each period’s return on the couple’s portfolio is drawn at random. MaxiFi ranks all 500 trajectories for a given strategy based on the trajectories’ average living standards (averaged between the current year and the couple’s last possible year of life). The 5th percentile for a given strategy is the one that has the 5th lowest average living standard. The 95th percentile has the 95th highest average living standard.
Consider the 5th and 95th percentile trajectories for the Risky strategy. They both start at a much higher spending (and, therefore, living standard) level. The green 5th and 95th percentile curves start at the lowest spending (and, therefore, living standard) level. By consuming more early on, the Risky strategy entails lower spending in the future compared with the Safe strategy regardless of whether returns are high or low. The Base strategy entails long-run 5th and 95th percentile spending (and living standards) that are higher than the Risky strategy, but lower than the Safe strategy.
The bottom line is that how aggressively Sam and Martha spend impacts both the tilt and the spread of their 5th-95th percentile trajectory cones. The more aggressively they spend, the more their trajectory cones tilt down, but the smaller the long-run living standard spread between. Our case study on portfolio choice makes clear that holding the “as if” real return fixed (i.e., holding spending behavior fixed), investing more aggressively will spread out the living standard cones. Hence, more aggressive spending coupled with a more aggressive investing strategy leads to a cone that starts higher, is more spread out, and tilts down relative to a cone arising under more cautious spending and more cautious investing behavior.
Expected Remaining Lifetime Expected Utility Under the Three Spending Behaviors
As mentioned, economists use the term “utility” to reference your wellbeing or happiness. Measuring someone’s absolute happiness is impossible. But economists can and do measure relative happiness, for example, how much happier you’d be were you to experience a permanently higher 20 percent higher living standard.
In running MaxiFi’s risk analysis, Sam and Martha have the program generate 500 living standard trajectories for each of the three spending behaviors specified in the Base, Safe, and Risk strategies. MaxiFi then plugs each set of 500 trajectories into a mathematical formula, called a lifetime utility function. This formula measures the lifetime happiness Sam and Martha experience from a particular trajectory. The program averages over the 500 realized levels of lifetime happiness to form the average (expected) remaining lifetime utility of the particular strategy being evaluated.
The chart below compares average lifetime utility under the three strategies. It does so based on a critical question MaxiFi asks of Sam and Martha. Specifically, it asks them about their risk tolerance. As you can see, depending on how risk tolerant the couple is, MaxiFi provides different rankings of the three strategies.
One immediate conclusion is that spending in a hyper conservative manner through time, as dictated by the Safe strategy, is not Sam and Marth’s expected utility-maximizing move. For example, if they are highly risk average and can’t tolerate much risk, the Safe strategy is 58 (100 less 42) percent worse than the Base strategy. This means that the Safe strategy delivers, on average, the same remaining lifetime utility as spending according to the Base strategy but having 58 percent of that spending taxed or otherwise taken away regardless of the situation you’re in.
Why does the Safe strategy fare so poorly for all degrees of risk tolerance? The answer is that it moves far too much spending into Sam and Martha’s future years. That spending provides more happiness, but due to the household’s aversion to low spending (risk aversion), the early loss of spending extracts a very big prize.
How about the Risky spending strategy? It beats the Base strategy if Sam and Martha are either moderately or somewhat risk tolerant. This makes sense. If Sam and Martha are highly risk averse, they’ll be terribly concerned about spending very little at the end of life due to spending too aggressively early on. And if they are very risk tolerant, they’ll find the reduction in their long-run upside living standard too costly, which, of course, arises if they eat up their resources very rapidly early on. But with moderate degrees of risk aversion, the advantage of securing consumption (avoiding risk) by spending relatively more early on can outweigh the long-term downside spending danger.
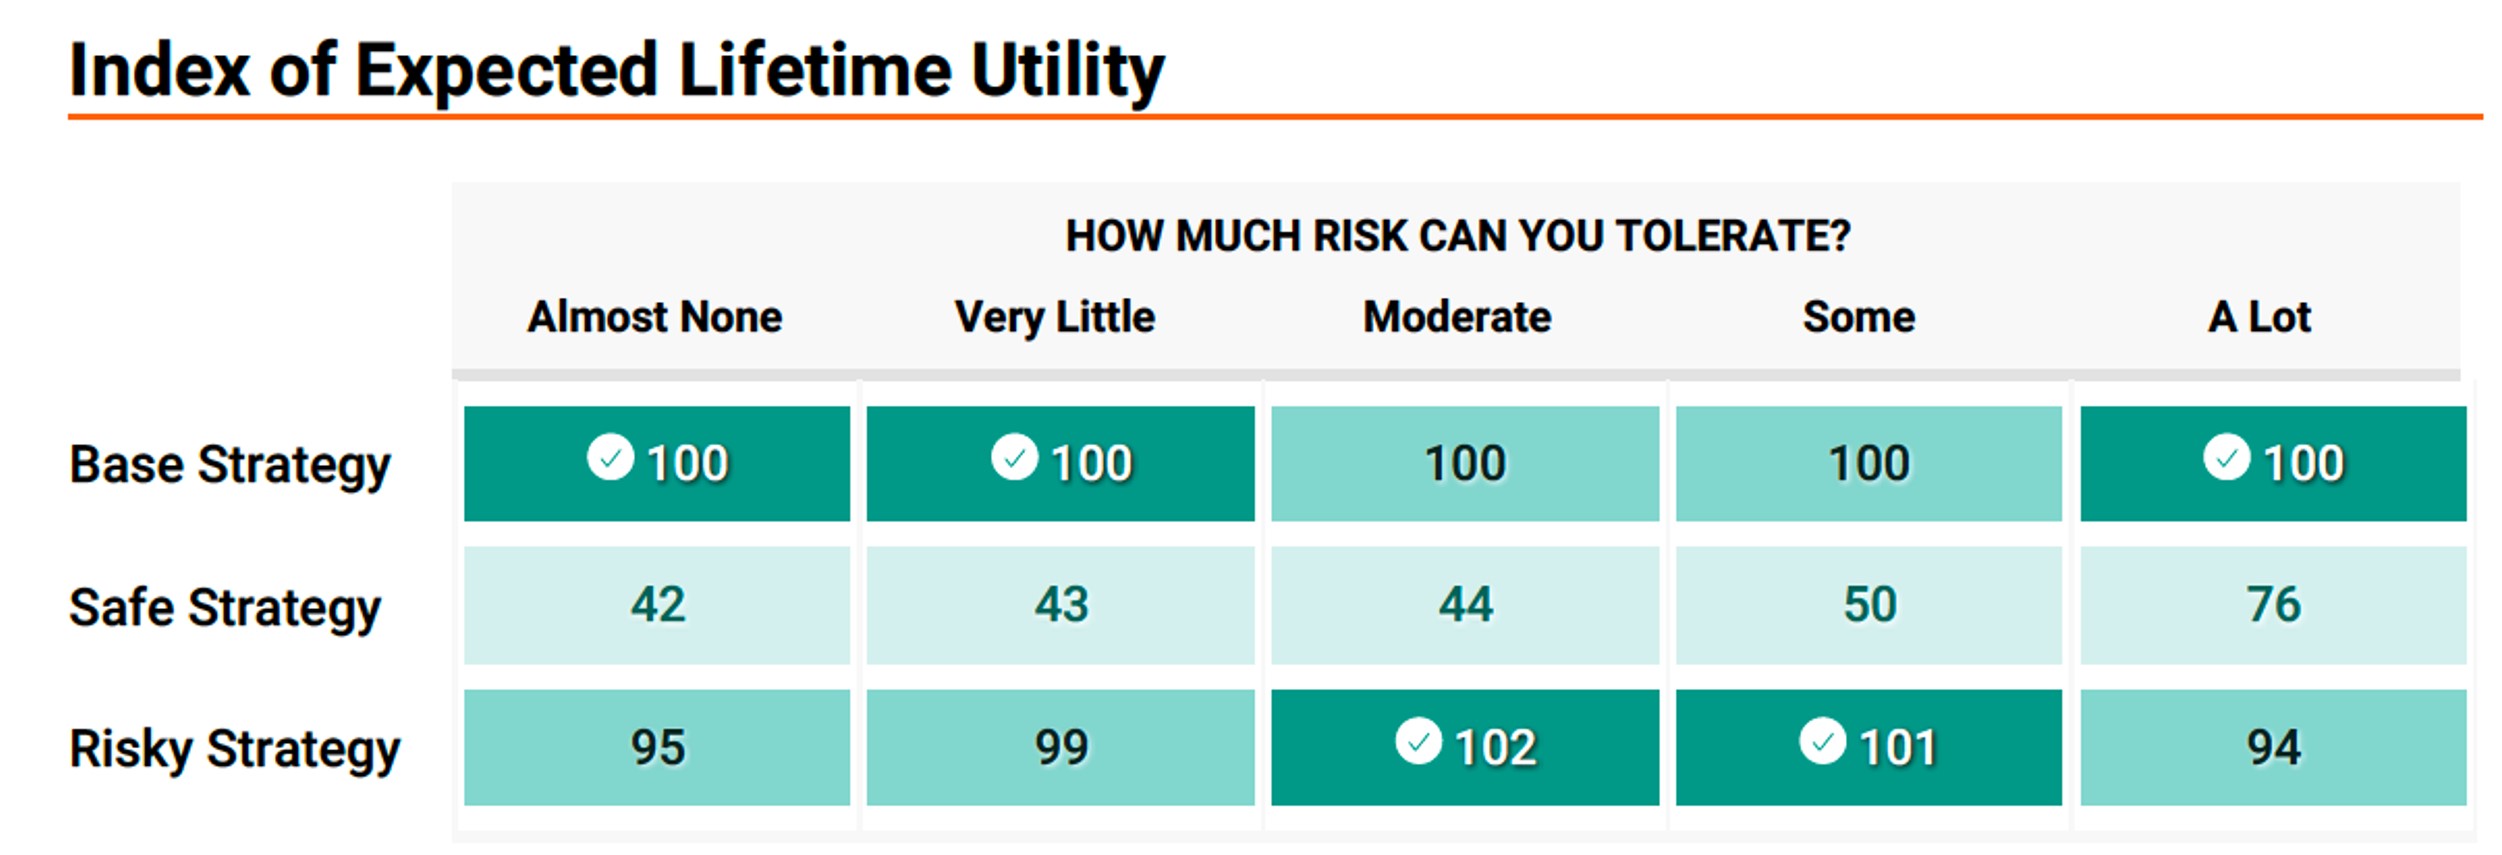
The chart compares the lifetime (actually, remaining lifetime) utility the couple can expect, on average, to enjoy under the Safe Strategy and the Risky Strategy relative to the Base Strategy. Note that this comparison depends on Sam and Martha’s tolerance for risk, which economists call their risk aversion. The three strategies in this table all entail the same 50-50 stock-bond portfolio allocation through time. They differ with respect to their spending behavior. The Base strategy assumes the couple will always spend as if they will earn a 1 percent return above inflation for sure. The Safe strategy makes that “as if” real return negative 5 percent. And the Risky strategy makes it positive 5 percent.
Methods
MaxiFiPRO generates 500 living standard trajectories for each strategy. Consider the Base Strategy, which entails a 50-50 bond-stock investment allocation as well as the 1 percent real return spending behavior. In forming its first living standard trajectory for this strategy, MaxiFi starts in the current year, when Sam and Martha are 54 and calculates what Sam and Martha will spend and, therefore, what their living standard per person will be, in the current year. MaxiFi does this by running its standard Base Case report assuming they couple will earn, year in and year out in the future, 1 percent real on their investments.
Next it takes a draw of the returns on Sam and Martha’s portfolio of 50-50 bonds and stocks for the current year. Knowing their asset income, what they’ve decided to spend in the current year (at age 54), and their other inputs, MaxiFi moves them to age 55 and repeats the calculation. I.e., it determines how much they’ll spend at 55 if, again, they spend based on always earning 1 percent real at age 55 and in all future years. MaxiFi’s risk analysis continues forward in this manner until Sam and Martha reach age 100, their maximum ages of life in this example. As it proceeds to calculate the couple’s living standard as they age, MaxiFi is solving, at each age, a certainty problem – how much should the couple spend if it shows up at age X with assets Y and will earn for sure 1 percent real going forward. This is why MaxiFi’s living standard Monte Carlo methodology represents a certainty equivalence technique.
Once the first living standard trajectory -- the path of Sam and Martha’s annual living standard from ages 54 through 100 -- is calculated, Maxifi starts afresh with the couple at age 54 and produces a second living standard trajectory through age 100, and it again returns to the couple’s being age 54 and produces a third trajectory, and on and on until it has generated 500 living standard trajectories (living-standard paths from age 54 through 100). These trajectories are summarized by MaxiFi, but all 500 are used to determine the average (expected) lifetime utility under the Base Strategy. This value is indexed at 100.
Next, MaxiFi makes the same set of calculations for the Safe and Risky Strategies, i.e., it generates 500 living standard trajectories for each strategy and then calculates average (expected) lifetime utilities arising under those strategies for different degrees of risk tolerance (degrees of risk aversion). The resulting average values of lifetime utility under the three investment/spending strategies are then used to make the expected lifetime utility comparisons shown in the above chart.
2We developed our novel certainty equivalence technique in roughly 2010 and included it in ESPlanner, MaxiFi’s download predecessor tool. Thanks to our use of parallel processing and other specialized techniques, MaxiFi’s living standard Monte Carlo analysis is perfectly precise and runs amazingly fast. ESPlanner may have been the first or one of the first uses of certainty equivalence in generating Monte Carlo simulations in finance.
3We assume a constant relative risk aversion utility function, which implies that utility in any given year is the couple’s living standard raised to a power that incorporates its degree of risk aversion. In the chart, the degree of risk aversions are 1, 3, 5, 7, and 9, where 1 references most risk tolerant and 9 references least risk tolerant.