A couple discovers important information about asset allocation, risk analysis, and a new concept, expected lifetime utility maximization.
The Facts
Married couple, Age: 54
Sam’s earnings: $50,000
Martha’s earnings: $200,000
Combined 401k savings: $1,000,000
Regular Assets: $400,000
Housing: Own $1,000,000 home
Sam and Martha are deciding how to invest their assets. They are overwhelmed by the options and besieged by people offering advice. The couple turns to MaxiFi’s risk analysis for help, specifically its expected lifetime utility maximization.
“Utility” references your wellbeing or happiness. Measuring someone’s absolute happiness is impossible. But economists can and do measure relative happiness, for example, how much happier you’d be with a 20 percent higher living standard.
MaxiFi’s risk analysis produces 500 living standard trajectories for your Base investment/ spending strategy as well as 500 living standard trajectories for two other strategies called the Safe and Risky Strategies. (You can change those names.) It then compares these trajectories, including the lifetime happiness (lifetime utility) you can expect to experience, on average, under the two alternatives relative to the lifetime utility you can expect under your Base Strategy.
Your input to this comparison is critical. The program asks you about your risk tolerance and uses your answer to compare the lifetime utility you can expect to enjoy, on average, under the three strategies.
An “investment/spending strategy” references two key choices you need to make through time -- how aggressively to invest and how aggressively to spend. Both choices will influence the living standard trajectory you are likely to experience.
But now back to the case study!
The Base Case
Sam and Martha are 54 and married. Martha makes $200,000 per year as an accountant and Sam earns $50,000 annually as a social worker. The couple owns a $1 million home in Massachusetts and pays $3,698 in monthly payments on their 30-year, $500,000 mortgage. They also pay $10,000 per year in property taxes, $5,000, annually, to cover maintenance, and another $5,000 annually to cover homeowner’s insurance. Their non-mortgage housing expenses are assumed to keep even with inflation. Sam and Martha plan to retire at age 62 and immediately start taking Social Security. The couple has $400,000 in regular assets and $1,000,000 in combined retirement savings.
Creating an Investment Plan
Sam and Martha want to consider investing in stocks notwithstanding the risk. To begin their analysis, Sam and Martha click on MaxiFi’s Risk Analysis report. For their Base investment/spending strategy, the couple specifies a 50-50 stock-bond portfolio. They also tell MaxiFi that each year when it comes to deciding how much they should spend that year, they’ll do so assuming they’ll earn 1 percent real (above inflation) going forward on their investments. This is a cautious spending assumption, but it will keep them from eating up their assets at too rapid pace, protecting them, particularly in the long term, against downside, living-standard risk. Thus, whether or not their investments did well or poorly in the prior year, they’ll make their age-54 spending decision based on earning 1 percent real year after year in the future.
Sam and Martha adopt the same spending rule for their Safe and Risky investment/spending strategies. As they tell each other over breakfast each day, “Whether our investments do well or poorly, we’ll spend, at each point in time, as if we’ll earn 1 percent real (after inflation) going forward.”
Their Base Strategy, to repeat, is 50-50 bonds and stocks. But for their Safe Strategy they specify a 80-20 bond-stock portfolio through time. For their Risky Strategy, they make it 20-80.
Results
MaxiFi’s Risk analysis report generated the following table.
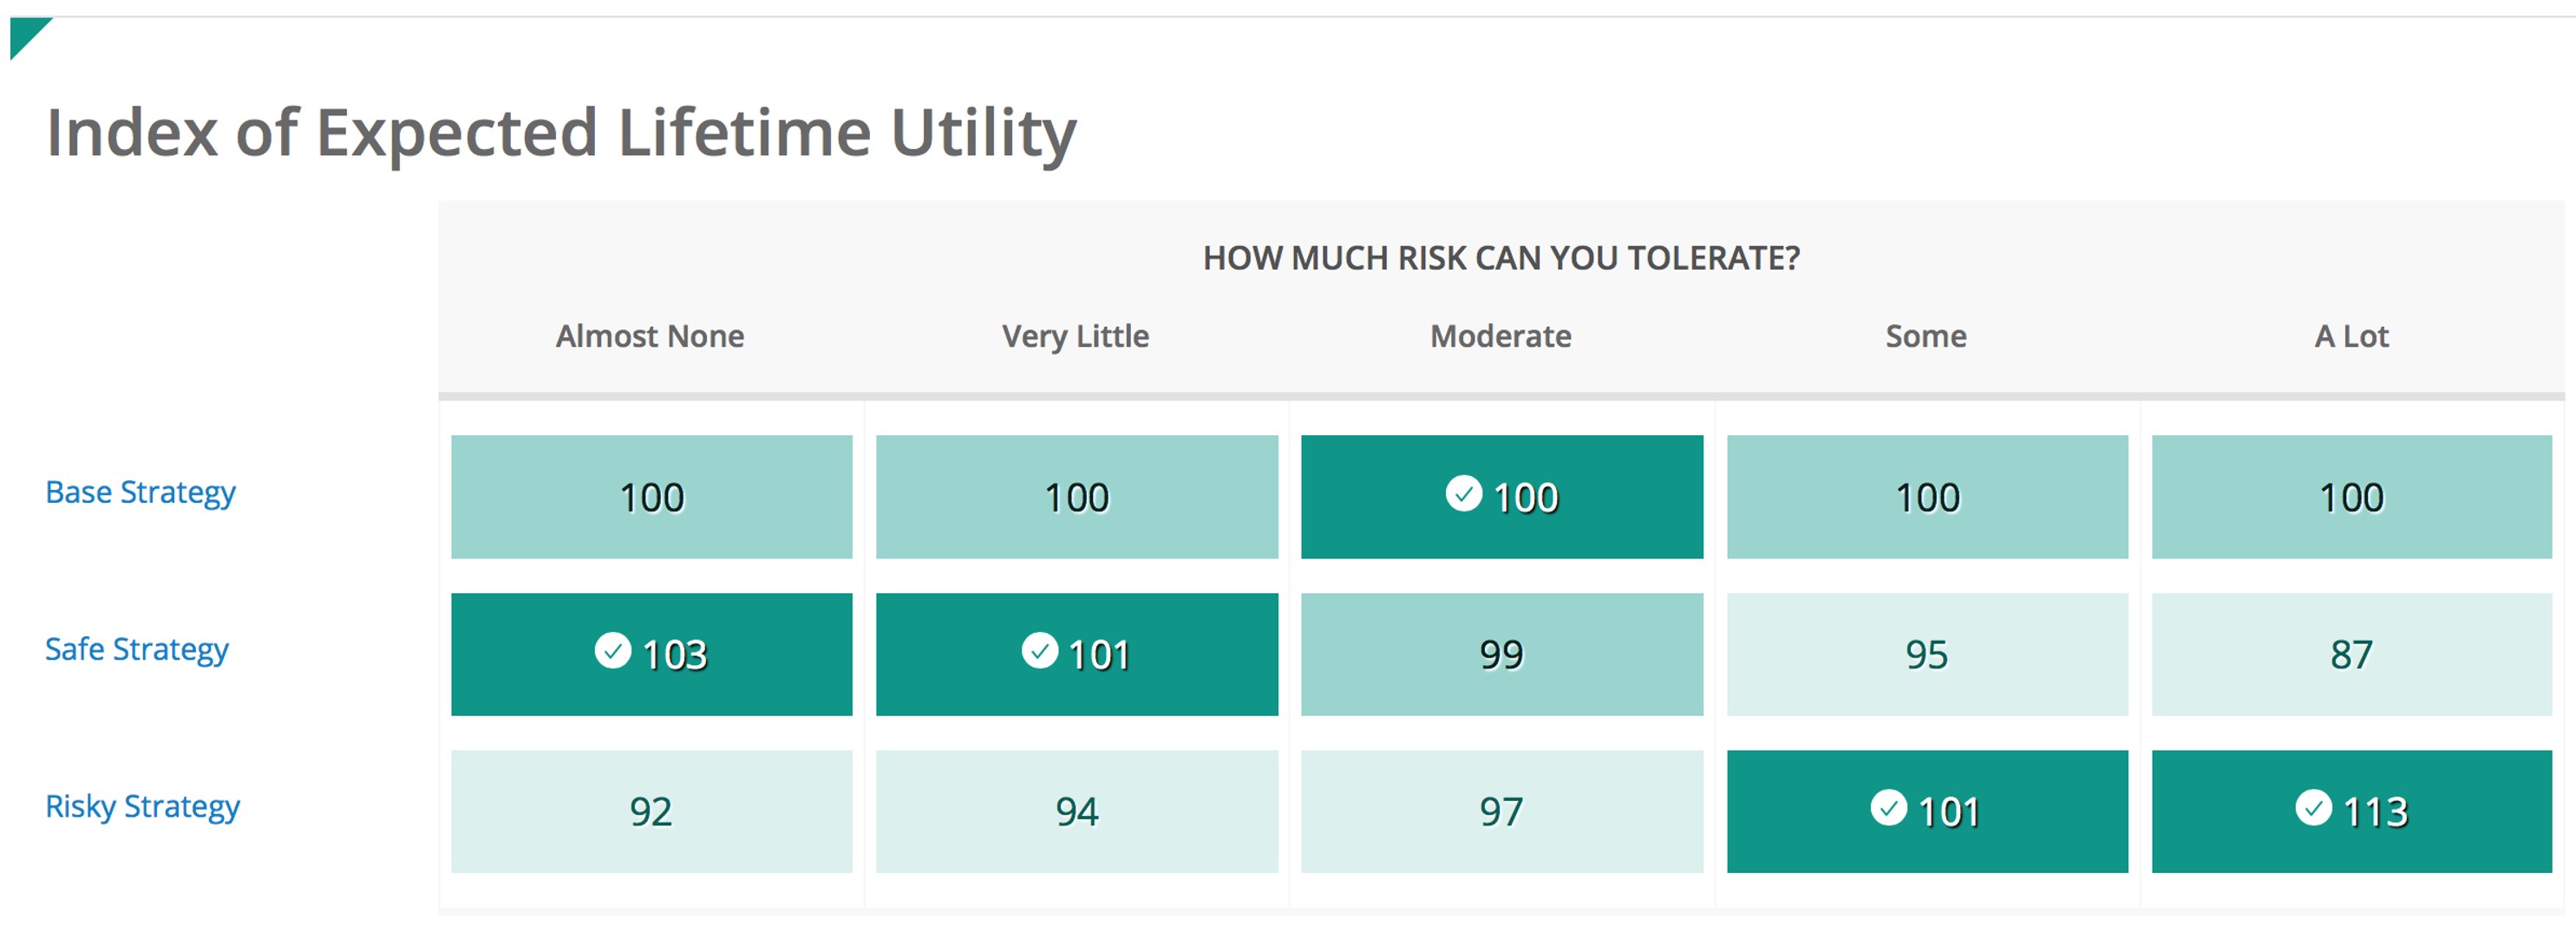
The chart compares the lifetime (actually, remaining lifetime) utility the couple can expect, on average, to enjoy under the Safe Strategy and the Risky Strategy relative to the Base Strategy. Note that this comparison depends Sam and Martha’s tolerance for risk, which economists call their risk aversion.1 After talking it over, Sam and Martha conclude they are moderately risk averse and, based on the chart, decide that a 50-50 bond-stocks portfolio beats both the Safe (80-20) and Risky (20-80) alternatives. 2
Methods
MaxiFi Premium and MaxiFi Professional generate 500 living standard trajectories for each strategy. Consider the Base Case, 50-50 investment strategy. For the first trajectory, MaxiFi calculates what Sam and Martha will spend and what their living standard will be at 54 by running the program’s Base Case report assuming they’ll earn 1 percent real year in and year out in the future. Next it takes a draw of the returns on Sam and Martha’s portfolio of 50-50 stocks for the year they are 54. Knowing their asset income, what they will spend at 54, and their other inputs, MaxiFi moves them to age 55 and repeats the calculation. In other words, it determines how much they’ll spend at 55 if they again assume they’ll always earn 1 percent real return. MaxiFi’s risk analysis continues forward in this manner through Sam and Martha’s maximum ages of life. I.e., it solves a series of certainty problems, which is why its Monte Carlo simulation technique is called certainty equivalence. Once the first trajectory is calculated as well as the trajectory of annual living standard outcomes per household member, Maxifi starts over and produces a second trajectory and then a third . . . until it has generated 500 trajectories. These are then displayed and used to determine average (expected) lifetime utility under the Base Case strategy. This value is indexed at 100. Next MaxiFi does the same set of calculations for the safe and risky strategies. It calculates the average lifetime expected utilities arising under each strategy and generates the values shown in the chart. 4
Sam and Martha’s Living Standard Trajectories
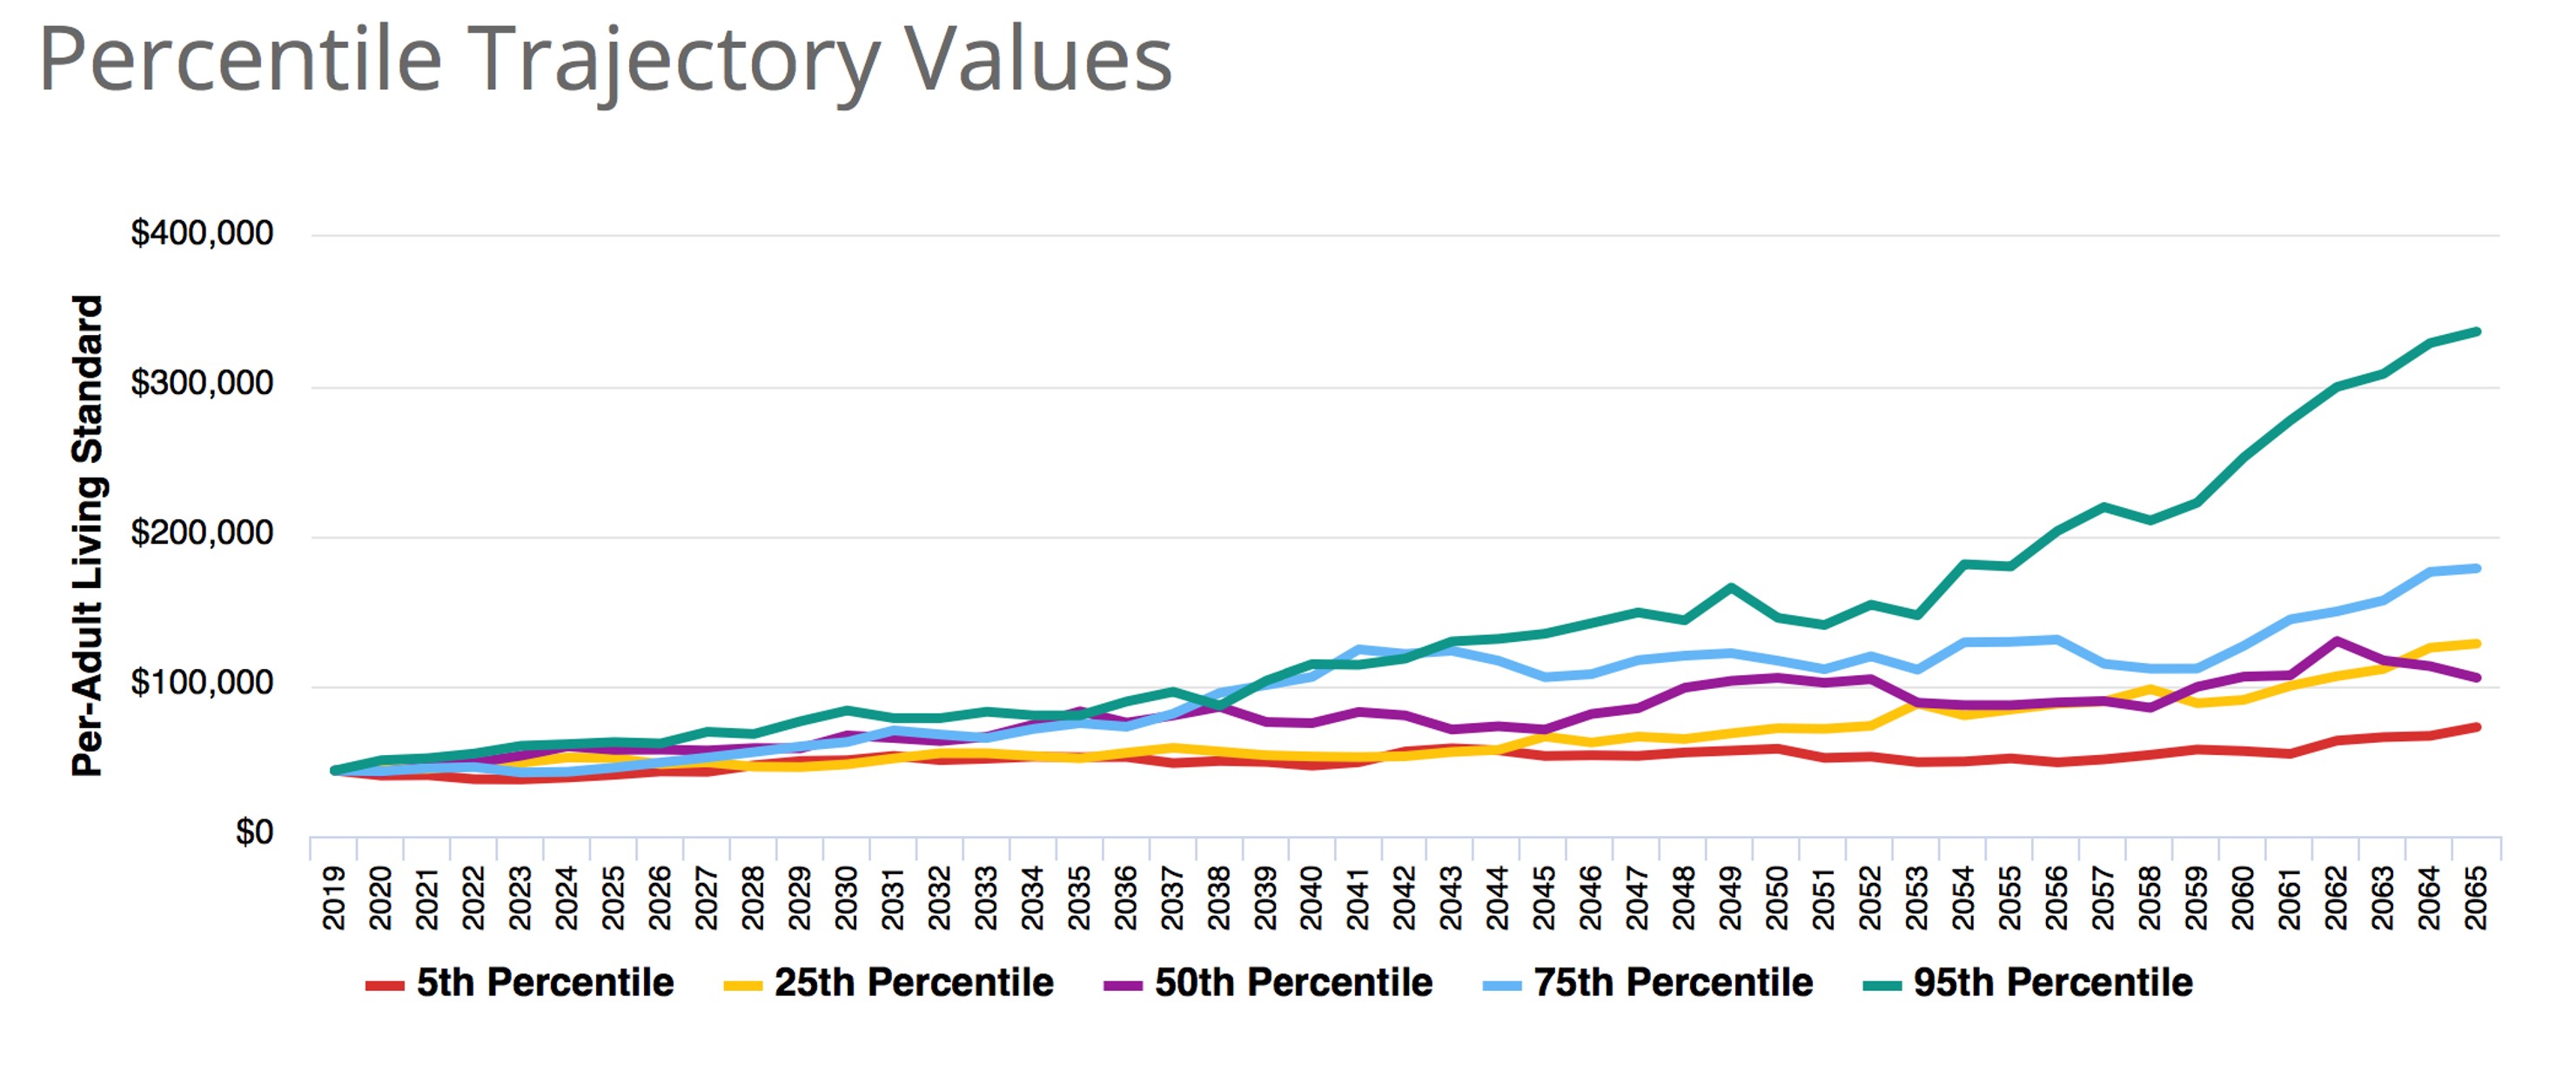
The chart below shows percentile trajectories for the Base Strategy. For example, the green curve shows the trajectory that produces the 95th percent highest living standard averaged, not across trajectories, but for the same trajectory over Sam and Martha’s remaining possible years of life.
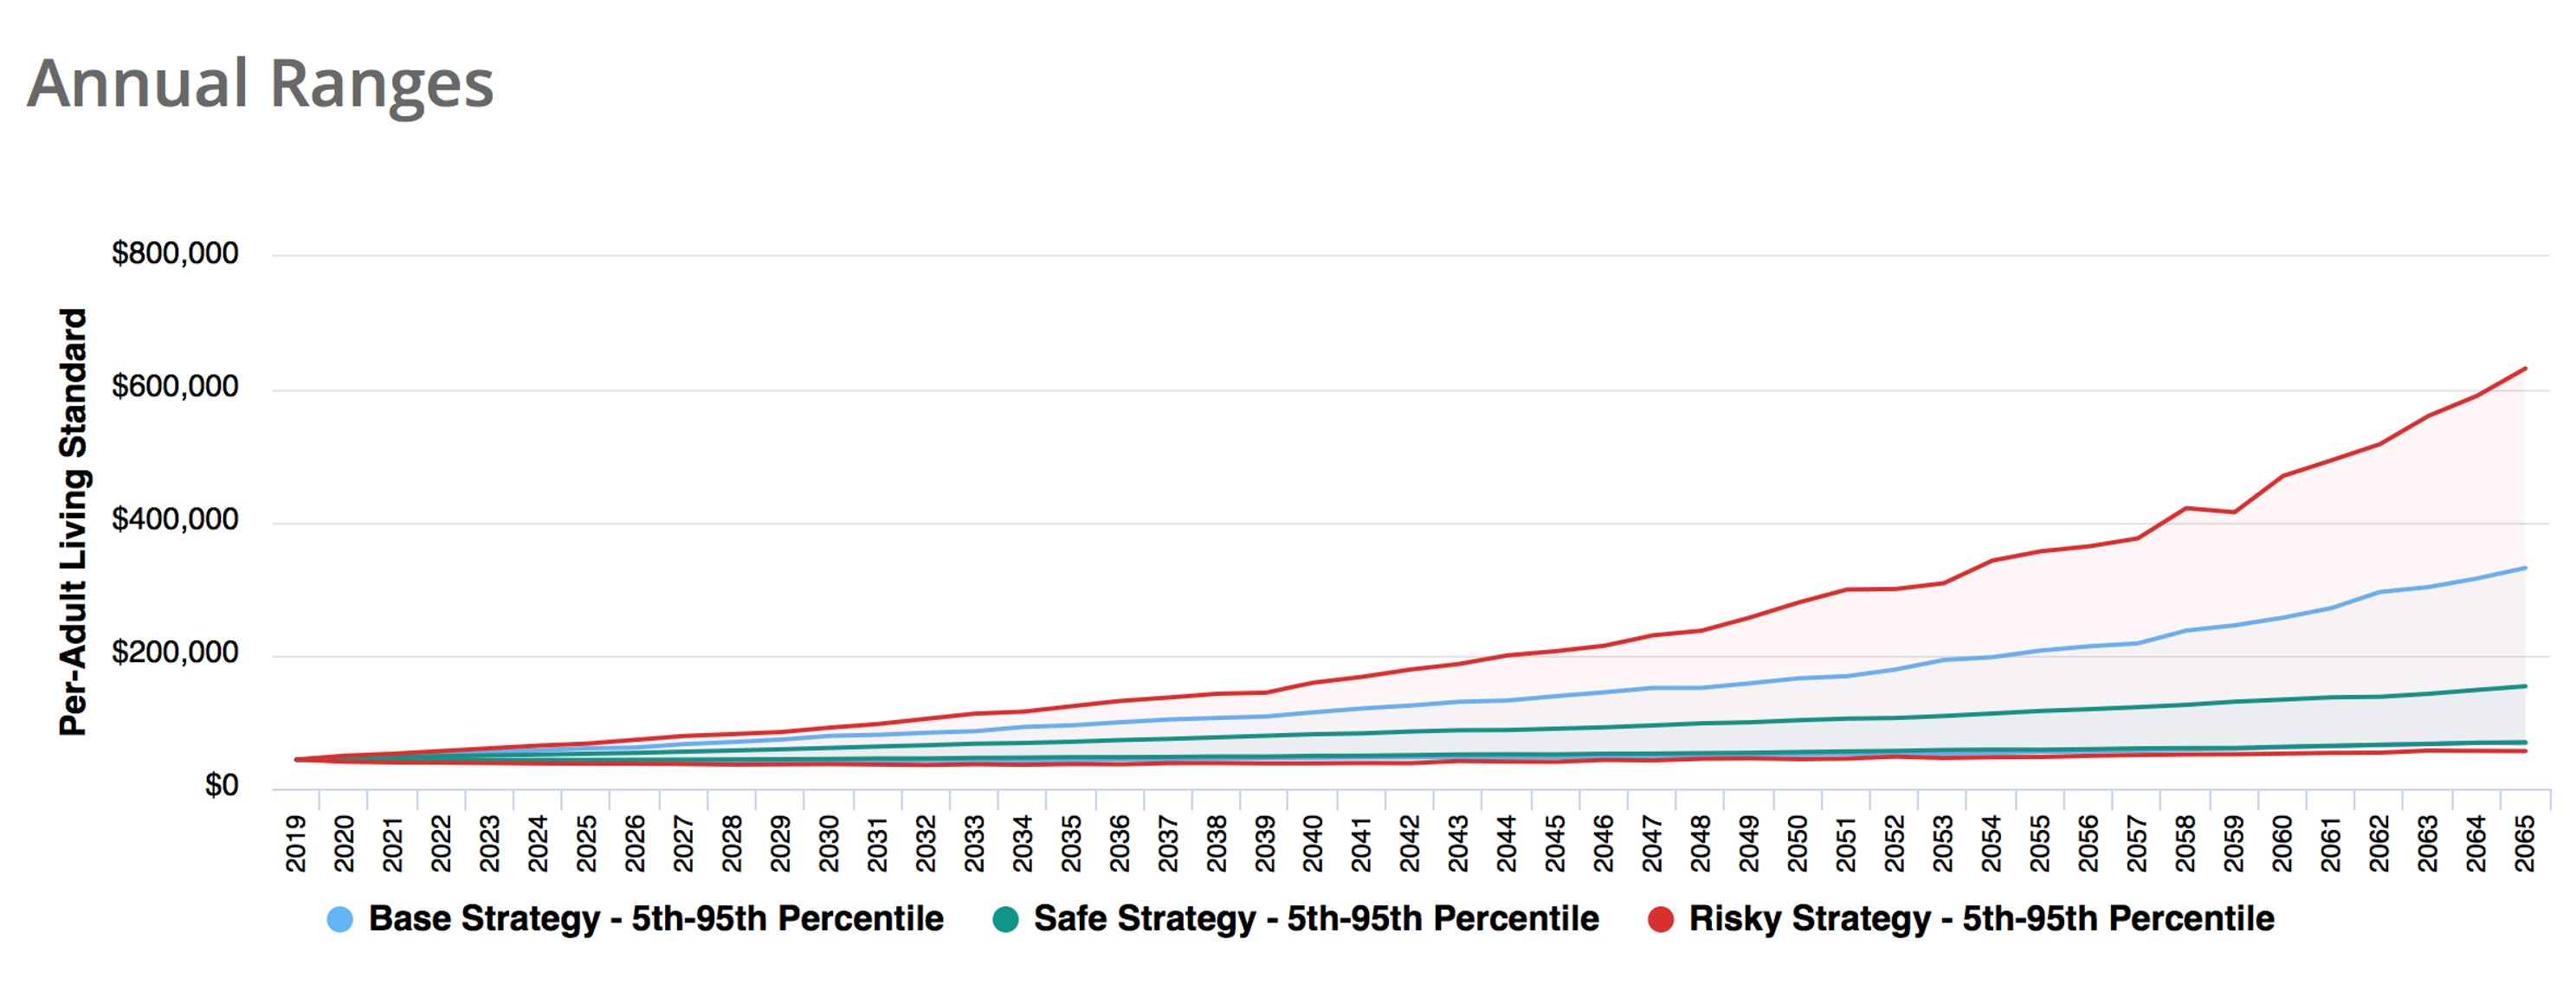
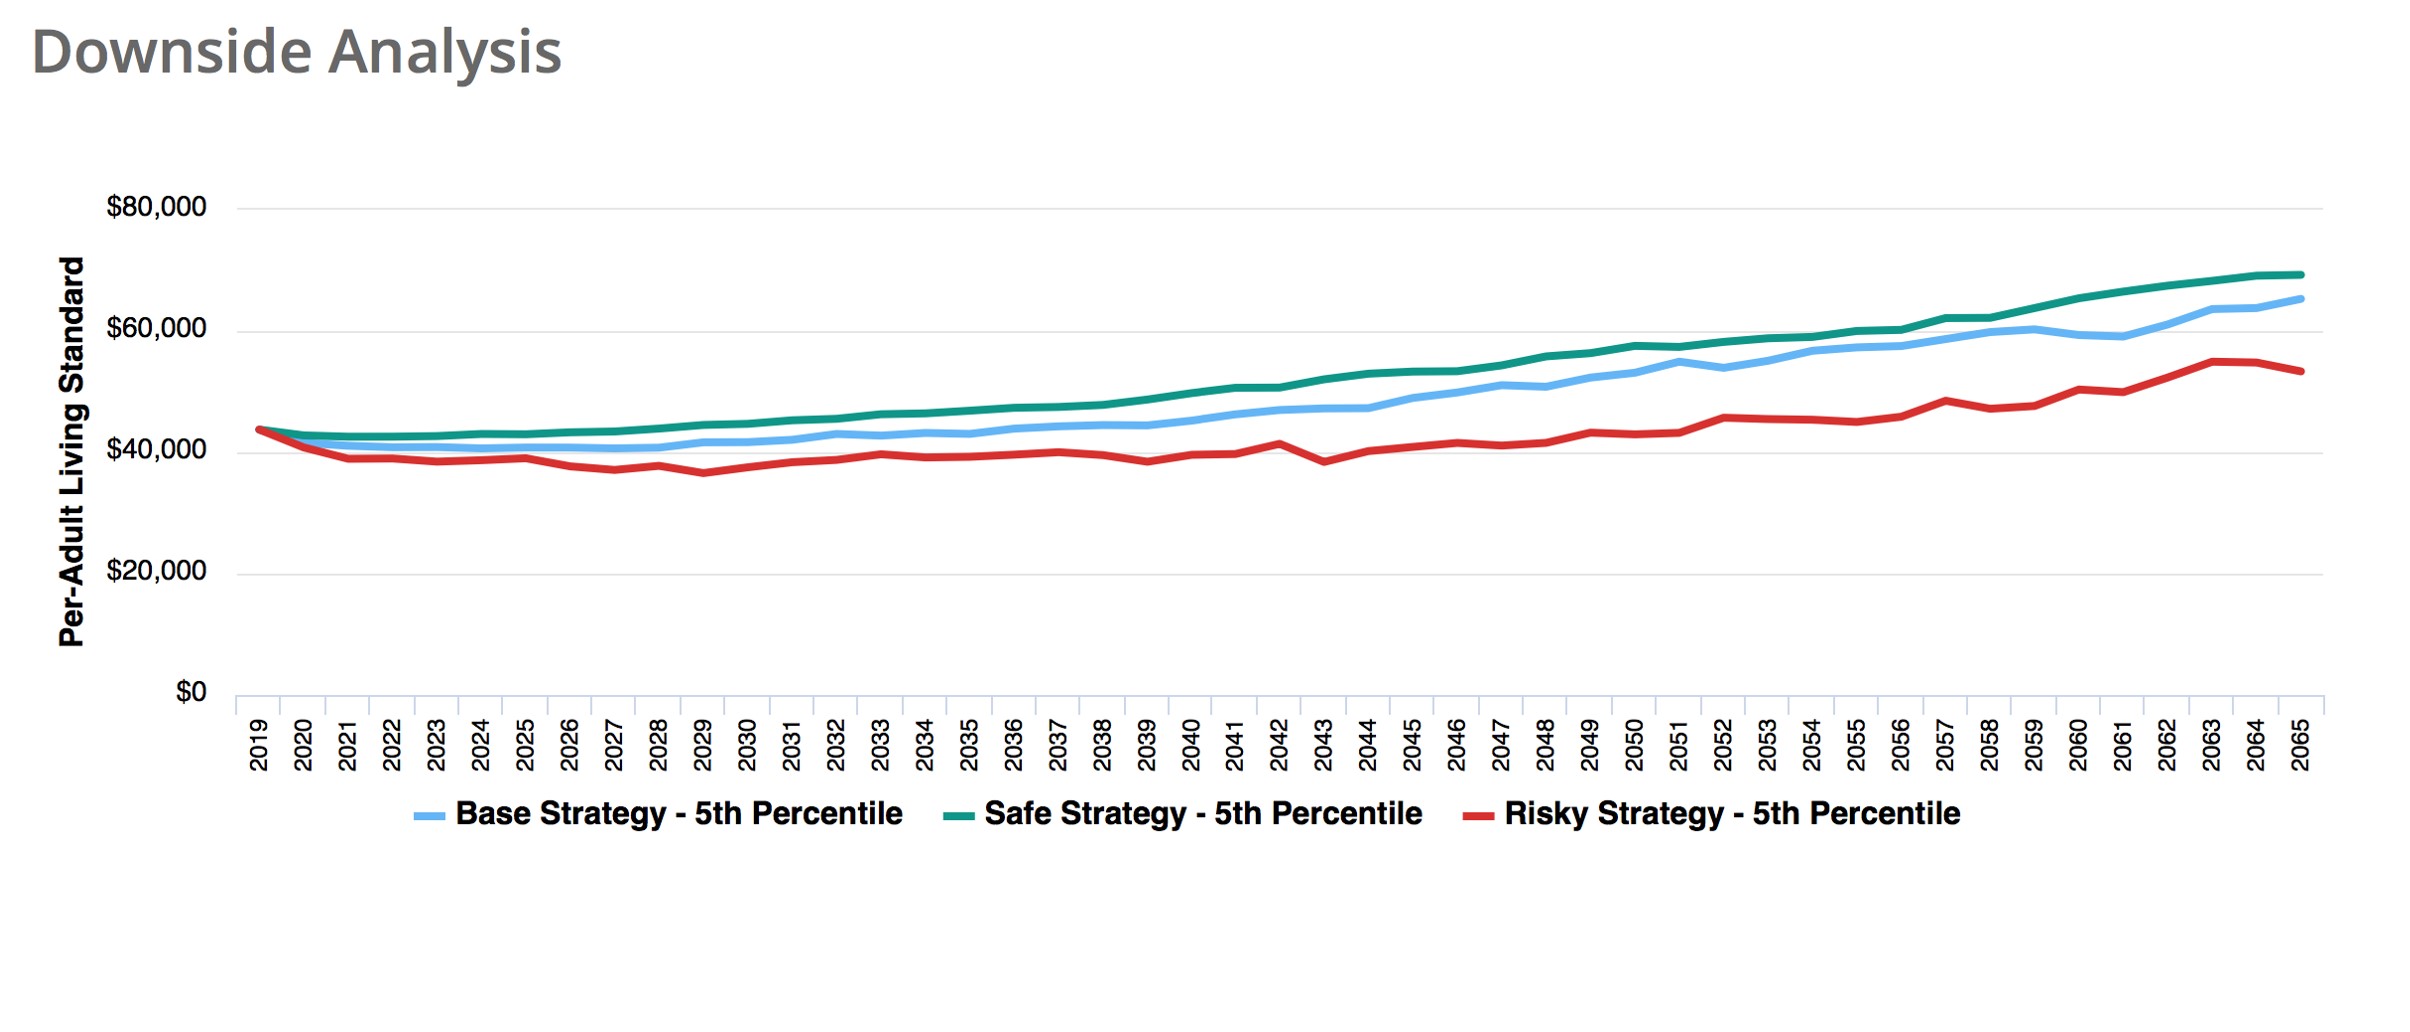
The next chart compares 5th and 95th percentile trajectory values across the three investment/spending strategies. The red curves are for the Risky Strategy. The green are for the Safe Strategy, and the blue is for the Base Strategy. As is clear, the Risky Strategy has more upside, but also more downside living standard risk than either the Base Strategy or the Safe Strategy. This downside risk is more apparent in the last chart, which displays just the 5th percentile living standard trajectories for the three investment/spending strategies.
2 A value of, say, 95 means that the average lifetime happiness from this investment/saving strategy is the same as would arise under the Base Strategy, but were the couple’s spending 5 percent less in all situations. A value of, say, 113, means that the average lifetime happiness for this strategy is the same as that what would enjoy under the Base Strategy, but with 13 percent higher spending in all situations.
3 We developed our novel certainty equivalence technique in roughly 2010 and included it in ESPlanner, MaxiFi’s download predecessor tool. Thanks to our use of parallel processing and other specialized techniques, MaxiFi’s living standard Monte Carlo analysis is perfectly precise and runs amazingly fast. ESPlanner may have been the first or one of the first uses of certainty equivalence in generating Monte Carlo simulations in finance.
4 We assume a constant relative risk aversion utility function, which implies that utility in any given year is the couple’s living standard raised to a power that incorporates its degree of risk aversion. In the chart, the degree of risk aversions are 1, 3, 5, 7, and 9, where 1 references most risk tolerant and 9 references least risk tolerant.