A household explores the practical meaning of a market crash.
The Facts
Married couple, Age: 66 and 65
John's earnings: $0 (retired)
Mary's earnings: $0 (retired)
John's 401K savings: $750,000
Mary's 401K savings: $750,000
Non-retirement assets: $400,000
There may be many ways to assess the damage from a sudden downturn in the market like we experienced in March of 2020: You can look at the percentage decline in the Dow or the S&P 500. You can look at the decline in your own portfolio (which will likely be less—perhaps much less—than the decline in pure equities). You can read the headlines and imagine the worst.
These abstract measures, though alarming or frightening, don't tell you a whole lot beyond "not good"! A more practical and more concrete assessment involves looking at the impact on your annual spending allowance, what MaxiFI Planner refers to as your annual discretionary spending.
The concept of "consumption smoothing" has been covered in other case studies, but in brief it goes like this: most of us want to maintain an even living standard through time. Economists call this consumption smoothing. No one wants to be rich today and poor tomorrow, or vice versa. John and Jane in this case study have used MaxiFi to achieve a smooth living standard from the current year and throughout the duration of their model. MaxiFi has calculated their annual household discretionary spending level through age 100.
It's a simple concept, but the patented algorithms underlying MaxiFi's calculations are highly complex. Once the program has calculated and discovered the internal or "endogenous" annual spending level, that annual amount can be used as a benchmark against which to compare any changes in the model. Say you had a model that revealed an annual spending level of $98,123 for every year from the current year through age 100. Next you run an alternative model where the only change you make is that you create a $321 taxable receipt 27 years from now. After running the comparison report, you would discover a new annual spending level starting in the current year through age 100. In this example, the change in annual spending level would be trivial, but the point is that the program is finding it and you can see, in practical terms, the real impact—starting this year—of a trivial receipt 27 years from now. Once you appreciate the magic of this simple concept, you have at your disposal a very powerful planning tool for analyzing much more complex what-if scenarios.
In this case study, we will explore the impact of a sudden and alarming market downturn in the current year.
The Base Plan
Discretionary Spending is Smooth—the Benchmark Case
Data for John and Jane, a hypothetical couple, are shown above. Although it's not shown, we've also entered a Social Security earnings history for each spouse. Housing costs, taxes, and Medicare B are calculated and together comprise off-the-top or fixed spending. When we refer to "discretionary spending" we are referring to the available annual spending after these annual fixed expenses are paid.
After running the Base Plan, we see that John and Jane's annual discretionary spending is $105,084. Discretionary spending represents all the available spending after payments for fixed expenses: taxes, housing, Medicare Part B premiums, and special expenses. This $105,084 is the amount they use to set their annual, inflation adjusted, spending budget net of fixed expenses.
The relevant assumptions for this case study relate to their nominal return on three pools of money: each spouse's retirement accounts and the household non-retirement account. Inflation is set to 2.5% for all years and a 2.5% nominal return (0% real return) is used for non-retirement assets and a cautious 3.5% nominal return is assumed for both spouse's retirement assets.
What if the Market Tanks?
An illustration of dynamic programming at work and consumption smoothing
Let's imagine now that John and Jane find themselves at the end of March in the middle of market turmoil. The Dow and S&P indexes are down nearly 25% YTD and things could get worse. Their non-retirement assets have been cautiously allocated to just 10% stocks and they see a YTD return at the end of March at 0% on the non-retirement pool of money. Their 60/40 retirement accounts, however, show a return of -13% YTD. They report that it was even worse a week earlier.
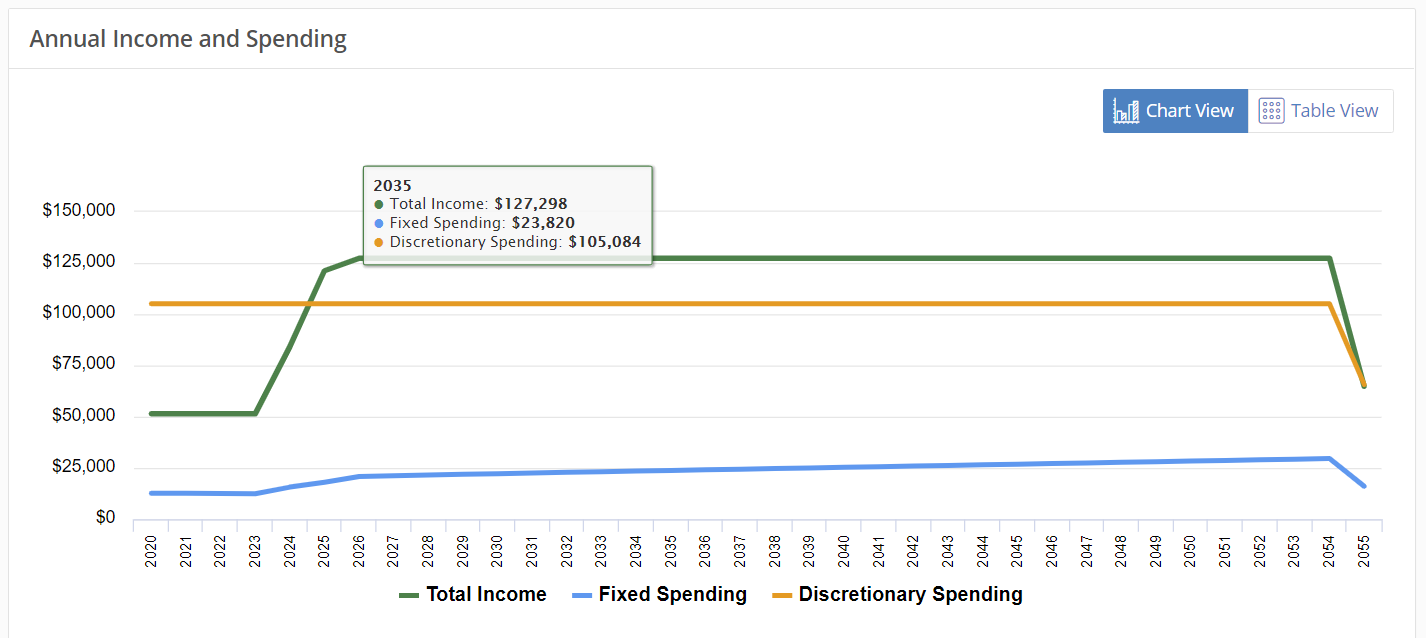
Let's study this chart above for a moment.
The graphic above shows the household annual spending of $105,084. This amount is the calculated (not user-supplied) annual spending available given their base profile assumption about a 2.5% nominal return on non-retirement assets and 3.5% nominal returns on each spouse's retirement account. This $105,084 becomes our benchmark that we can now compare against.
Let's assume now that when this market turmoil all shakes out, they will experience a year-end 2020 return of -10% in both retirement accounts and 0% in their non-retirement assets.
In other words, they say to themselves: We know the markets could recover some following the trend of last week, or they could get worse. But what if we assume that our nominal return for the current year is not the 3.5% in our base profile but rather -10%? And, what if the non-retirement assets earned, not 2.5% nominal, but 0%. In both cases they will assume that rates go back to their default assumption in 2021 of 2.5% and 3.5%. By using the "will the rate of return change" option in Settings and Assumptions and making sure to return that rate to default after one year, we can simulate this economic impact.
To view this comparison we will create an Alternative Profile and run a comparison report. The chart below shows the comparison.
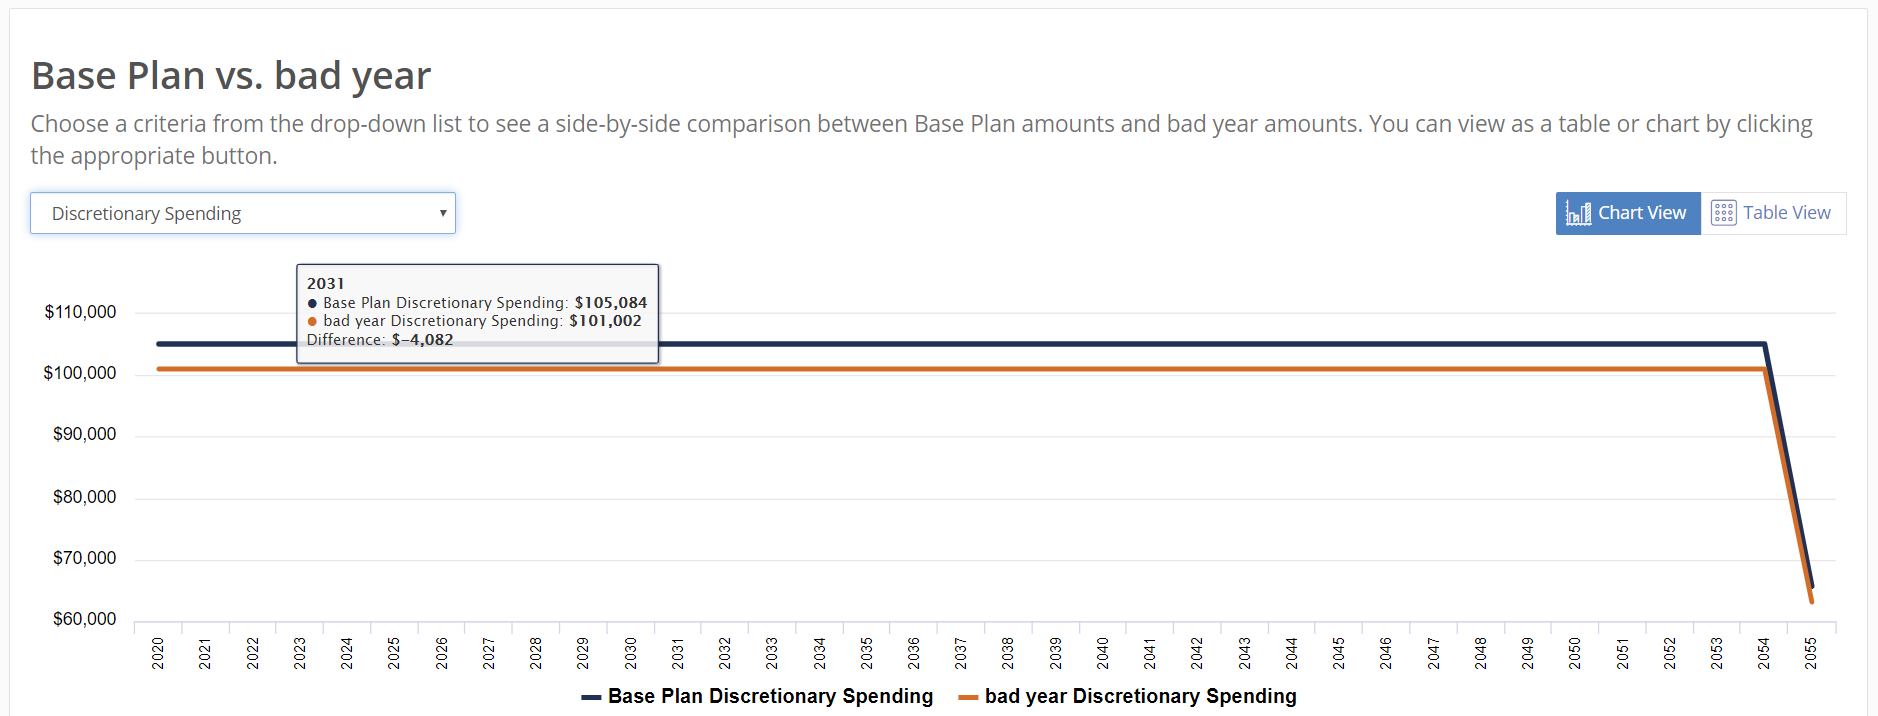
We see here a new annual discretionary spending allowance of $101,002. That's an annual drop of $4,082 each year through age 100. In other words, they will have $4,082 less to spend (after fixed spending on housing, taxes, Medicare B) than they had in the base profile model. That $4,082 represents a 3.9% drop in their living standard and the practical impact of this market turmoil if their worrisome assumptions about their 2020 annual return come to pass.
This illustration is of course just one imaginative case study. MaxiFI users are free to create their own model and use whatever assumptions they feel are reasonable. The important point here is that we don't have to look at a market drop in stocks of 25% and try to imagine how this might impact our lives going forward. We can build models and compare those models using different assumptions. The results or practical meaning of market downturns can be evaluated in terms of how they change our annual spending allowance, our discretionary spending. It's still just a model and it still involves assumptions, but it's better information than just feeling afraid or imagining the worst or, alternatively, whistling through the graveyard.
The Economics Approach In Action
No financial decision stands alone: income affects taxes, taxes affect spending, Social Security benefits and retirement account withdrawals affect income, which affects taxes, and on and on. Because MaxiFI Planner accounts for all of these mutual influences, it provides a sophisticated approach to financial planning that you can't find in other planning calculators. Even a $1,000 expense far into the future impacts what we can spend this year when using this kind of model. No other calculator does this kind of dynamic programming. Because you can see the impact of all of your lifetime expenses and receipts in terms of available discretionary spending, an annual amount that is recalculated with each new model you build, you can quickly compare models in ways that have practical and intuitive meaning.